Nationals Arm Race

"… the reason you win or lose is darn near always the same – pitching.” — Earl Weaver

Archive for the ‘ben johnson’ tag

30 for 30 Review: “9.79*”

2 comments

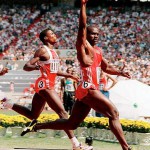
This should have been a seminal athletic moment of the 80s. It ended up being so, but for very different reasons. Photo unk via dailymail.co.uk

Editor’s note: there are spoilers in this review, and if you have not seen the film they are surprising enough that you may want to skip this post and see the film first.

The 2nd installment in the return of the “30 for 30” series aired on October 9th, 2012 and is titled “9.79*.”  Directed by Daniel Gordon (a decently acclaimed british documentarian), it tells the story of the 1988 100m Men’s final from the Seoul Olympic games.  As most sports fans would be able to tell from the title, the race was won by Ben Johnson in a then-world record time of 9.79, an astounding improvement upon the standing world record and a seminal event in the sports decade.

Soon after though, Johnson tested positive for the use of Steroids, was stripped of his medal and booted from the games, and the event was a shocking introduction to the world of doping and the use of performance enhancing drugs that has only exploded since.  Nowadays, we hear about Baseball players using steroids and the narrative is familiar.  The USADA just released its report by which it made the decision to charge and eventually ban Lance Armstrong and attempt to strip him of titles won 10+ years prior.  But in 1988, the only knowledge of doping that casual sports fans knew of was allegations of eastern bloc athletes (women mostly) who were astoundingly breaking records in Swimming, Track and Weight Lifting.

(Here’s an excellent review of the film, doing it much better than I: avclub.com)

As with before, I’ll break down talking about the Subject Matter and then the film-making.

Subject Matter: the film maker got all 8 participants in the 1988 100m final to appear on film and talk somewhat candidly about the state of the sport leading up to that race, the role of drugs, and the ethical dilemna they all faced.  Contrast this to prior 30 for 30 films about Allen Iverson and Michael Jordan which didn’t include any on-screen interviews from the subjects.  The fact that Johnson himself speaks at length and openly about the experience makes this a pretty compelling watch.  Even more-so based on points we’ll touch on later…

The film starts off with an anonymous quote, “If you don’t take it, you don’t make it.”  The implication is, if you’re a runner in the 1980s and you’re not taking drugs, then you’re not going to win.  At least one of the interviewees (Calvin Smith, he himself a banned doper who was awarded the Bronze medal upon Johnson’s disqualification) talked openly about this choice.  Runners train extremely hard to only have a shot at coming in 5th or 6th place in the face of other runners who were cheating, leading (much as we saw in the Cycling world) to an escalating arms race of doping to “re-level” the playing field.  It is an awful choice to make for an athlete; stay clean and never win, or cheat like everyone else and give yourself a shot at lucrative glory.  I don’t know what choice I’d make if forced to.

(Editor note; I mis-quoted Smith in this paragraph; it was someone else who spoke about doping, not Smith.  By all accounts, Smith never failed a doping test and many think he should have been retro-actively awarded the Seoul gold medal after the three men ahead of him all subsequently failed tests.  Thanks to a commenter for pointing this out).

The film doesn’t outright “accuse” Carl Lewis of doping himself, but the implication is pretty clear and pretty stark.  One person talks about how taking HGH forces adults to get braces (since the substance causes the jaw bone to grow far after it typically stops growing in adults), and then a few minutes later shows Lewis in 1987 … wearing braces.  Lewis himself doesn’t do himself any favors, nor does his coach and head cheerleader Joe Douglas, who seemed all too eager to brag about the sundry things that went on, or about the money that was greasing the skids in the mid 1980s in the sport.  I was left after watching thinking that Lewis was just as dirty as the rest of the competition, just that he got “out-roided” in the final.

A very frank interview with the head of the testing lab from the 1984 Olympic Games also raised some eyebrows; he accused the powers-that-be of outright ignoring the results they were seeing, and he seemed to imply that the 1984 Olympic organizers ordered him to sweep positive tests under the table so as not to sully those politically-charged games.  He kept previous samples and re-tested them years onward and found rampant drug use in the 1984 games, but he decided to destroy the evidence rather than re-open yet another investigation into past results.  I slightly disagreed though with the premise of the lab director that testing is a simple either/or principle; as Malcolm Gladwell pointed out on a recent “BS Report” podcast, to conclude that an athelete has tested positive for certain markers (especially testosterone) is incredibly difficult, since your natural testosterone levels ebb and wane on a day to day basis, are affected by your moods and naturally degrade as you age.  They’re even affected by what you eat!  And, as we learned in the Ryan Braun debacle, testosterone levels in samples can quickly change if not properly stored (If you don’t know what I’m talking about, read my post on the topic from February 2012 and read Will Carroll‘s amazon story about what *really* happened.  It is well worth the read.  Or just read this piece at the HardBallTimes to understand why I don’t believe Braun cheated at all).  So unfortunately drug testing is more of an art form than something that provides conclusive proof.  And that is troubling, since in order to justify its existence a drug testing lab needs to, you know, find people who cheated.

The most outrageous point of the documentary made came from Johnson, and was a shocker.  He accused a member of Lewis’ camp of spiking his post-race beer after the 1988 100M final with the same steroids he then tested positive for.  The accused person refused to be interviewed on film but provided an incredible quote when asked whether he spiked the drink; he said something along the lines of, “Maybe I did, and maybe I didn’t.”  What kind of answer is that??  Of course he’s not going to admit such a thing, but the lack of a powerful denial almost seems like proof in and among itself that this hanger-on of Lewis’ purposely spiked the drink.  The back-story of the bad blood between the runners and the massive competition for the fastest times in the season leading up to the Olympics, to go with the arrogance of Lewis and his coach makes the accusation of a spiked drink completely believable.

From a film-making perspective, I thought the documentary was very well filmed, with excellent b-roll shots of Toronto (where Johnson is from) and other on-location spots.  You can slightly quibble with the “faked” footage, but most of the b-roll is used as supporting shots being played during quotes from the participants.  It was a little difficult to understand all the interviews, mostly because of the heavy West Indian accent of Johnson and his country-mates.  But that also may be because I was watching the film late at night and trying not to wake my wife :-).  I’d place this film somewhere in the middle-range of the pantheon of 30-for-30 films.  It was an interesting watch but i’d probably not bother to watch it again.
Incentives, Salary and Steroid use in Baseball

3 comments

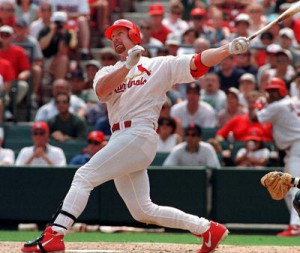
Hit home runs, make lots of money. Repeat. Photo unknown via deadspin.com

A viewing of the HBO special “Freakonomics,” which turns chapters of the popular book into little mini vignettes, along with a conversation with my father prompted me to investigate the aspects of human behavior with regard to incentives when considering the rise of Steroid use by major league baseball players in the late 1990s.  One of the overriding themes in Freakonomics is that any aspect of human behavior can be predicted by analyzing the incentives facing those persons when making a choice.

So the question here is, were the growing incentives to players in terms of rising baseball salaries directly tied to the growing use of Steroids in the mid 1990s?

Steroids had been around for many years prior to appearing en-masse in Baseball.  The most infamous use came from the East German Olympic teams during the late 70s and early 80s, who systematically doped their own athletes (mostly without the athlete’s knowledge) from 1971 until 1990.  But seemingly only after the 1988 Seoul Olympics saw sprinter Ben Johnson test positive for one steroid and admitted the use of a host of other Steroids, Testosterone and HGH substances did the “Steroid Era” in baseball start.  In fact, 1988 is also acknowledged as the beginning of the era in the Mitchell Report (per Section D of the Summary, pg SR-14).  However, I’d argue that the mainstream usage of Steroids didn’t occur for a few years after (see the rise of 45+ homer seasons below).

Here’s a chart of Mean and Median US household income from 1974-2010, with the Minimum and Maximum MLB salaries, the Average MLB salary, that MLB salary listed as a multiple of the US mean income, and the number of 45+ home run seasons seen per year:

Year Median Income: Current Dollars Mean Income: current dollars Minimum MLB Salary Maximum MLB Salary Average MLB Salary Avg MLB salary as multiple of Mean US income # of 45+ Homer Seasons
2012 $480,000 $32,000,000
2011 $414,000 $32,000,000 $3,305,393 0
2010 $49,445 $67,530 $400,000 $33,000,000 $3,297,828 49 1
2009 $49,777 $67,976 $400,000 $33,000,000 $3,240,206 48 3
2008 $50,303 $68,424 $390,000 $28,000,000 $3,154,845 46 1
2007 $50,233 $67,609 $380,000 $23,428,571 $2,944,556 44 4
2006 $48,201 $66,570 $327,000 $21,680,727 $2,866,000 43 5
2005 $46,326 $63,344 $316,000 $26,000,000 $2,632,655 42 5
2004 $44,334 $60,466 $300,000 $22,500,000 $2,486,000 41 4
2003 $43,318 $59,067 $300,000 $22,000,000 $2,555,000 43 4
2002 $42,409 $57,852 $300,000 $22,000,000 $2,383,000 41 4
2001 $42,228 $58,208 $300,000 $22,000,000 $2,264,000 39 9
2000 $41,990 $57,135 $200,000 $15,714,286 $1,987,000 35 4
1999 $40,696 $54,737 $200,000 $11,494,794 $1,726,000 32 6
1998 $38,885 $51,855 $200,000 $14,936,667 $1,378,000 27 9
1997 $37,005 $49,692 $200,000 $10,000,000 $1,314,000 26 3
1996 $35,492 $47,123 $200,000 $9,237,500 $1,101,000 23 6
1995 $34,076 $44,938 $109,000 $9,237,500 $1,094,000 24 1
1994 $32,264 $43,133 $100,000 $6,300,000 $1,154,000 27 0
1993 $31,241 $41,428 $100,000 $6,200,000 $1,062,000 26 3
1992 $30,636 $38,840 $100,000 $6,100,000 $1,012,000 26 0
1991 $30,126 $37,922 $100,000 $3,800,000 $845,383 22 0
1990 $29,943 $37,403 $100,000 $3,200,000 $589,483 16 1
1989 $28,906 $36,520 $60,000 $2,766,667 $489,539 13 1
1988 $27,225 $34,017 $60,000 $2,340,000 $430,688 13 0
1987 $26,061 $32,410 $60,000 $2,127,333 $402,579 12 3
1986 $24,897 $30,759 $60,000 $2,800,000 $410,517 13 0
1985 $23,618 $29,066 $60,000 $2,130,300 $368,998 13 0
1984 $22,415 $27,464 $30,000 $2,500,000 $325,900 12 0
1983 $20,885 $25,401 $30,000 $2,500,000 $289,000 11 0
1982 $20,171 $24,309 $30,000 $2,500,000 $245,000 10 0
1981 $19,074 $22,787 $30,000 $2,500,000 $195,500 9 0
1980 $17,710 $21,063 $30,000 $2,500,000 $146,500 7 1
1979 $16,461 $19,554 $16,000 $1,170,000 $121,900 6 3
1978 $15,064 $17,730 $16,000 $700,000 $97,800 6 1
1977 $13,572 $16,100 $16,000 $700,000 $74,000 5 1
1976 $12,686 $14,922 $16,000 $700,000 $52,300 4 0
1975 $11,800 $13,779 $16,000 $670,000 $44,676 3 0
1974 $250,000 $40,839 0

There’s several landmark seasons of note in terms of escalating Salaries through this list.  By year:

  • 1975 saw Catfish Hunter become the first “true” Free Agent subject to bidding wars among teams, and signed a 5yr/$3.35M deal with the Yankees that resulted in his league-leading salary to nearly triple the league leading salary from 1974.
  • 1979 saw Nolan Ryan become the first $1million/year player.
  • In 1982 George Foster became the first $2M/year player.
  • By 1989, Kirby Puckett became baseball’s first $3M/year player.
  • In 1992, Barry Bonds hit free agency on the heels of MVP seasons in Pittsburgh and more than doubled the previous high annual salary.
  • By 1996, salaries were rising quickly; Albert Belle signs a $10M/year contract.
  • 2001 saw Alex Rodriguez‘s infamous Texas contract kick in, paying him $22M/year, nearly $7M more per year than the next closest player (Kevin Brown, who signed baseball’s first 9-figure contract).
  • Rodriguez opted out of that same contract and re-negotiated the terms even higher with the Yankees, eclipsing the $30M/year mark by 2009.

Meanwhile, take note of the red-colored years of 1996 to 2001, the core of the Steroid Era.  1996 saw no less than Six players eclipse the 45 home run barrier, including Brady Anderson in a complete aberration year for the lead-off hitter (he hit 50 homers in 1996 but averaged just 19 per 162 game segment and never hit more than 24).  Suddenly in 1998 no less than Nine players eclipsed the mark, lead by the Mark McGwire/Sammy Sosa home-run hitting competition that transfixed the nation and “saved” baseball.  Too bad we now know what America didn’t know then; that both players were using Performance Enhancing drugs to beef up, help power out baseballs and take advantage of a slew of new ballparks that opened in the era that featured cozier dimensions and more offense.

By 2002, enough pressure from the front office towards the player’s union had taken place to start testing, leading to the infamous “anonymous survey” done of players in 2003 that resulted in “between 5-7%” of players testing positive, leading to mandatory testing in 2004.  By 2008 we were back down to homer levels not seen since the early 1990s, and baseball didn’t see a single player hit the 45 homer barrier in 2011.  But historically the damage has been done; the home run leader boards from the time period in question lists like a Who’s Who of steroid accusations, and a generation of middle-aged baseball writers who grew up idolizing the home run leaders of yesteryear now seems set to penalize these players for their drug usage (proven or otherwise, as with the Jeff Bagwell Hall of Fame case).

But, everything I just wrote is known narrative.  Lets talk about the explosion of baseball salaries as compared to the common man.  In 1975 the average MLB salary of $44k was a little more than 3-times the mean US household income, having risen only gradually over the years thanks to the Reserve clause and a non-existent players union.  It was a boon for owners, who kept salaries down and profits high.  But the low salaries also meant that most baseball players were considered “within reach” of the every-man in America.  Players weren’t paid such ridiculously high salaries that they essentially live in a different world from the fans (as is the case today with most professional athletes in this country): these players were considered “just like us” to a certain extent, and frequently had off-season jobs, working along side the same people who paid a few bucks for a bleacher seat to cheer them on.  “America’s Pastime” largely earned that title from being the only sport in town for most of the century, but was also helped along by the “within reach” argument.

By 1980, with the country in a severe recession and gas lines around the block, Joe Public slightly increased his average pay.  However, Baseball players, thanks to the breaking of the reserve clause and the rise of Free agency were seeing a boom in salary hikes.  By 1980, the average MLB wage was 9 times the median income in the country and a few ballplayers were making $1M/year.   This ratio of US income to MLB income grew slightly over the next decade; ten years on in 1990 the average MLB wage was just 16x the US income.  But changes were about to come.  In 1996 the MLB salary multiple was 23-times the US mean, but by 2001 it was nearly 40-times the US mean salary.  The average MLB salary more than doubled inside of these 5 years.  This change coincided exactly with the beginnings of the Steroid era and also mirror the 6 year stretch where the game saw its historical rise in home runs.

So the question is: is this coincidence?  Was the rise in steroid use driven by player’s desires to maximize their earning potential or was it vice-versa (i.e., players discovered steroids could escalate performance, started using and producing and that lead to the quick rise in payroll?)  Or was this all more attributable to weaker pitching driven by expansion and  smaller ball-parks?

I think you can make the case that home run hitters were highly compensated and were commercially the “heros” of the game (remember the “Chicks Dig the Long Ball” commercials?), and other players figured out that Steroids helped pack on muscle mass and enabled themselves to hit the ball further and faster (to say nothing of the fact that steroids enabled players to come back from injury faster and to stay stronger through the season by virtue of added muscle mass), and rode the trend.  Hit 40-45 home runs one year, sign a contract extension the next.  Suddenly the game found itself full of juiced up, highly compensated sluggers with a massive ethical problem.

What do you think?

Sources used:

Year Median Income: Current Dollars Mean Income: current dollars Minimum MLB Salary Maximum MLB Salary Average MLB Salary Avg MLB salary as multiple of Mean US income # of 45+ Homer Seasons
2012 $480,000 $32,000,000
2011 $414,000 $32,000,000 $3,305,393 0
2010 $49,445 $67,530 $400,000 $33,000,000 $3,297,828 49 1
2009 $49,777 $67,976 $400,000 $33,000,000 $3,240,206 48 3
2008 $50,303 $68,424 $390,000 $28,000,000 $3,154,845 46 1
2007 $50,233 $67,609 $380,000 $23,428,571 $2,944,556 44 4
2006 $48,201 $66,570 $327,000 $21,680,727 $2,866,000 43 5
2005 $46,326 $63,344 $316,000 $2,600,000 $2,632,655 42 5
2004 $44,334 $60,466 $300,000 $22,500,000 $2,486,000 41 4
2003 $43,318 $59,067 $300,000 $22,000,000 $2,555,000 43 4
2002 $42,409 $57,852 $300,000 $22,000,000 $2,383,000 41 4
2001 $42,228 $58,208 $300,000 $22,000,000 $2,264,000 39 9
2000 $41,990 $57,135 $200,000 $15,714,286 $1,987,000 35 4
1999 $40,696 $54,737 $200,000 $11,494,794 $1,726,000 32 6
1998 $38,885 $51,855 $200,000 $14,936,667 $1,378,000 27 9
1997 $37,005 $49,692 $200,000 $10,000,000 $1,314,000 26 3
1996 $35,492 $47,123 $200,000 $9,237,500 $1,101,000 23 6
1995 $34,076 $44,938 $109,000 $9,237,500 $1,094,000 24 1
1994 $32,264 $43,133 $100,000 $6,300,000 $1,154,000 27 0
1993 $31,241 $41,428 $100,000 $6,200,000 $1,062,000 26 3
1992 $30,636 $38,840 $100,000 $6,100,000 $1,012,000 26 0
1991 $30,126 $37,922 $100,000 $3,800,000 $845,383 22 0
1990 $29,943 $37,403 $100,000 $3,200,000 $589,483 16 1
1989 $28,906 $36,520 $60,000 $2,766,667 $489,539 13 1
1988 $27,225 $34,017 $60,000 $2,340,000 $430,688 13 0
1987 $26,061 $32,410 $60,000 $2,127,333 $402,579 12 3
1986 $24,897 $30,759 $60,000 $2,800,000 $410,517 13 0
1985 $23,618 $29,066 $60,000 $2,130,300 $368,998 13 0
1984 $22,415 $27,464 $30,000 $2,500,000 $325,900 12 0
1983 $20,885 $25,401 $30,000 $2,500,000 $289,000 11 0
1982 $20,171 $24,309 $30,000 $2,500,000 $245,000 10 0
1981 $19,074 $22,787 $30,000 $2,500,000 $195,500 9 0
1980 $17,710 $21,063 $30,000 $2,500,000 $146,500 7 1
1979 $16,461 $19,554 $16,000 $1,170,000 $121,900 6 3
1978 $15,064 $17,730 $16,000 $700,000 $97,800 6 1
1977 $13,572 $16,100 $16,000 $700,000 $74,000 5 1
1976 $12,686 $14,922 $16,000 $700,000 $52,300 4 0
1975 $11,800 $13,779 $16,000 $670,000 $44,676 3 0
1974 $250,000 $40,839 0