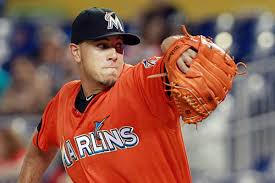
Jose Fernandez is (arguably) the biggest name to go down to TJ surgery yet. Photo via thestar.com
Its the biggest story in baseball so far in 2014. We’ve had nearly 20 MLB pitchers get diagnosed with torn elbow ligaments so far this calendar year. All of them have or are set to undergo “Tommy John” surgery (also known as ulnar collateral ligament/UCL replacement surgery). That’s nearly as many as who got the surgery ALL of 2013 and we’re just 6 weeks into the season. There’s an alarming trend upwards over just the past few seasons of pitchers getting this surgery. There’s been plenty more minor leaguers (two Nats farmhands in Erik Davis and Danny Rosenbaum have already gotten it in 2014) and already a couple of very high-profile draft prospects as well (including as discussed in this space potential 1st rounders Jeff Hoffman and Erick Fedde just in the last week).
Lots of people are talking about this story, especially some heavy-weights in the baseball world. A sampling:
- Dr. James Andrews, perhaps the most famous sports doctor in the world, attributes the growing trend to the rise in year-round baseball competition in the US.
- SI.com’s Jay Jaffe reviews Dr. Andrews comments and had other excellent stats about the trend in this April 2014 piece.
- The Washington Post’s Dave Sheinin did an excellent piece in the paper a few weeks ago about the injury, which he attributes to youth usage.
- Tom Verducci (he of the “Verducci effect”) proposed a solution in a column this week after the Jose Fernandez announcement. His idea? Lowering the mound across all levels of the sport. He draws this conclusion after hosting a very interesting round-table on MLB Network.
- Jayson Stark teamed up with ESPN injury analyst Stephania Bell and former player Alex Cora to discuss the rise in arm injuries in this ESPN.com video, and they follow Andrews’ theory of year-round pitching.
- Chris O’Leary, king of the Inverted-W (whether you believe his theories or not, I’ve included this link here) has his own theories as discussed here. He doesn’t really have much in the way of explanation, just more whining about how every pitcher’s mechanics has something you can complain about.
- Jeff Passan basically calls out baseball executives for not having any answers.
- If you want an index of all of ESPN.com’s stories on the topic, click here. It will have columns, analysis and press releases for individuals getting the surgery.
Some interesting stats about Tommy John surgery:
So what the heck is going on?? Lets talk about some theories. I’ll highlight them in Blue.
The new “hot theory” is essentially this: Over-throwing at Showcase events, which have become crucial scouting events for kids raised in the United States, are to blame. Thanks to the rise in travel leagues and select teams, scouts spend less time sitting at high school games and more time at these all-star events. To prescribers of this theory, it isn’t so much about the amount of innings or pitches that kids throw … its the nature of the “showcase” events and the high pressure situations that those events put kids under. Kids are throwing year-round, and they’re ramping up max-effort pitches at national competitions multiple times per year, and in some cases out of “season.” This leads to serious damage to kids’ arms done as 16 and 17 yr olds, which then manifests itself over the years and results in blown ligaments in pro ball.
Do you buy this explanation? It certainly makes sense to me, but how do you prove this? And, it doesn’t explain the similar rise in elbow injuries to non-American pitchers.
Is it less about the showcase events and more about the Larger Increase in Youth pitched innings thanks to the rise in Travel Leagues? This theory also makes some sense to me: thirty years ago kids played an 18-20 game spring Little League season, at best would pitch half those games and that was it. Maybe they played in the fall too, but there were specific innings limits in place that protected kids. Now instead of playing limited spring and fall seasons, kids are playing AAU travel teams that play 40-50 games a summer, plus weekend tournaments, plus (eventually) the above showcase events as they get closer to matriculation. This theory certainly is supported by a startling rise in youth arm injuries, as noted in this 2010 study by the American Academy of Orthopaedic Surgeons.
But, if its “bad” to play more baseball … then shouldn’t we be seeing even MORE injuries from players who grew up in third-world baseball hot beds like the Dominican Republic or Venezuela, where by all accounts kids play baseball from sun-up to sun-down 12 months out of the year in tropical climates?
Interestingly, of the list of 19 MLB players so far who have been diagnosed with a torn UCL (see next section), there’s 4 non-American developed pitchers (Rondo, Nova, Figueora, Cisnero). 4 of 19 = 21%, whereas about 22% of MLB pitchers are non-American developed (my 22% figure comes from this quick study that I did; I grabbed every active MLB pitcher as of early May 2014 and did a quick-and-dirty player upbringing analysis to determine that about 78% of players “grew up” in the current American system of player development). It is small sample size … but the percentage of american versus foreign developed players are so far exactly in line with the total percentage of each type of player in the larger pool of MLB pitchers. This doesn’t seem to support either of the two above theories.
We’ve all heard horror stories about pitch counts and pitcher abuse at high school events in Japan (this came to light over the winter as we looked at Masahiro Tanaka and learned about these Japanese showcase events; this article here at thebiglead.com talks about one Japanese prospect’s 772 pitches thrown over 9 days, and Jeff Passan talked about Tanaka’s own pitch count abuse stories and his average pitch counts as a Japanese-league pro). Unfortunately there’s not a ton of data available about this TJ theory and Japanese pitchers. I can find a couple of instances of Asian pitchers getting the surgery (Kyuji Fujikawa in 2012 being the most recent example), but not enough to establish any trends.
But lets state it this way: you can’t have things both ways. Both these stereotypes about player upbringing cannot be true:
- Latin American poor youth plays baseball from sun up to sun down 12 months a year, building arm strength constantly, therefore his arm is “stronger” and he’s less suceptible to injury
- American little leaguer plays limited schedules (18 games in the spring, perhaps fewer in the fall), has closely monitored pitch counts, therefore does not abuse his arm as a youth and thus his arm is “stronger” later in life as a result.
Here’s a list of the 19 MLB pitchers who have already gone under the TJ knife so far in 2014 (data from baseballheatmaps.com, which has detailed Disabled List data).
Of these 19 pitchers, they are evenly split between being starters (10) and relievers (9). So that doesn’t seem to lend itself to any Starter vs Reliever usage conclusion.
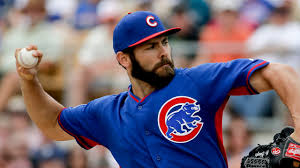
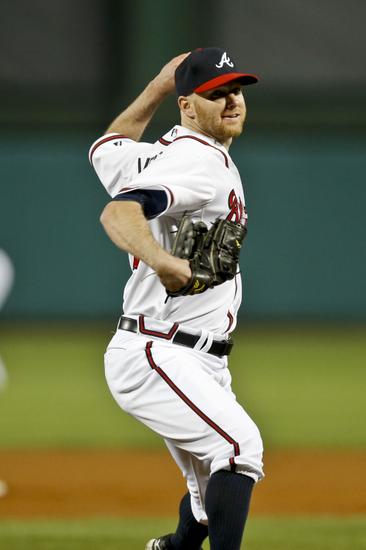
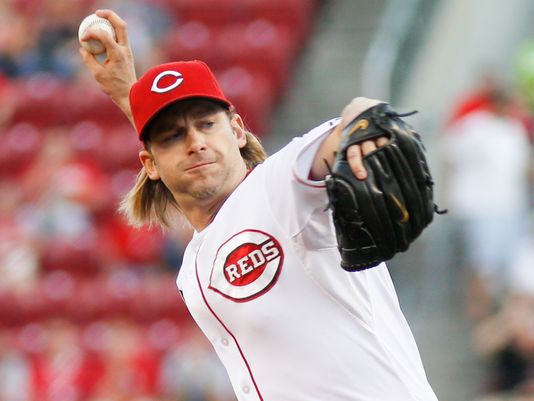
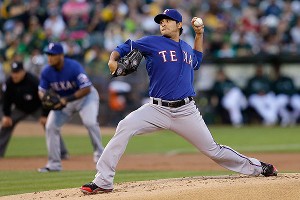
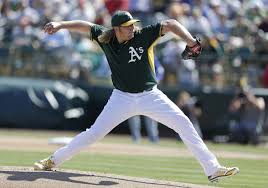
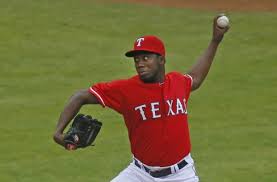
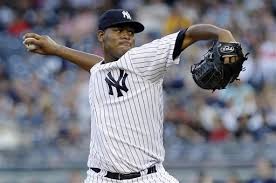
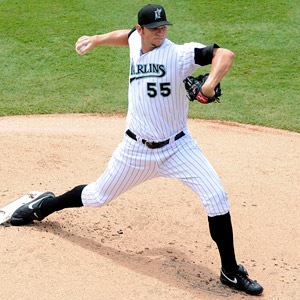
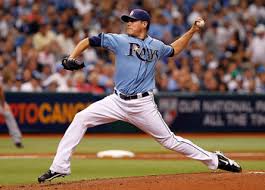
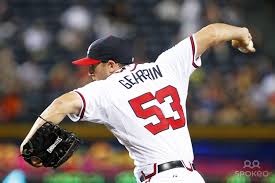
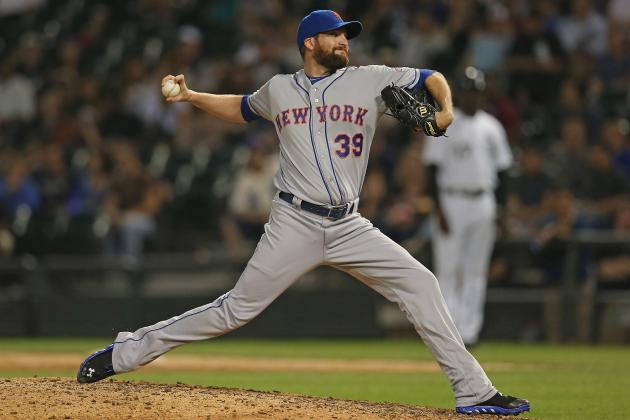
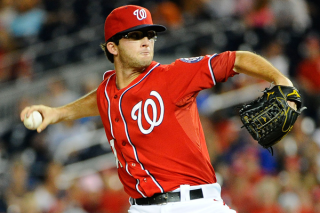
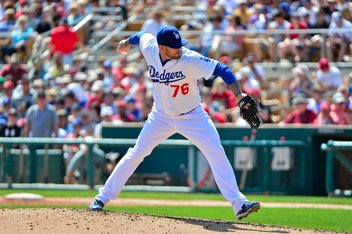
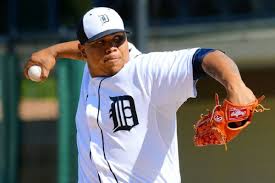
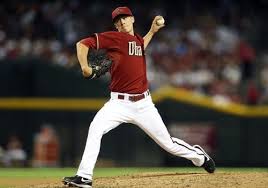
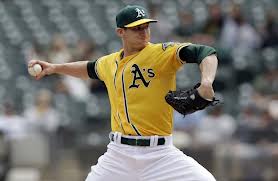
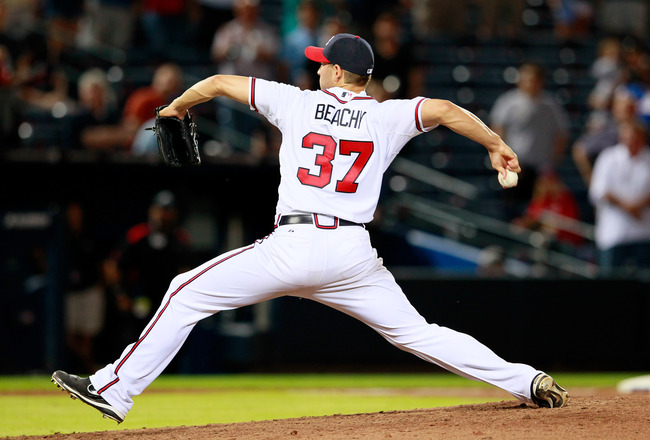
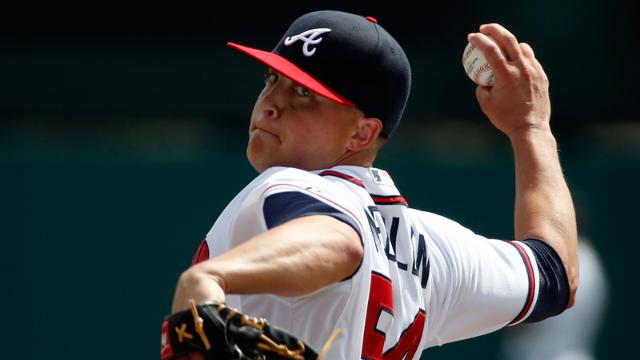
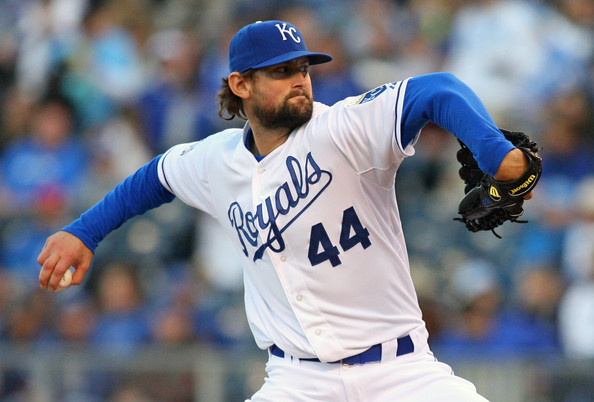
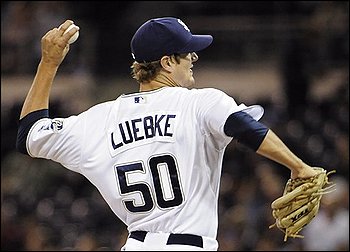
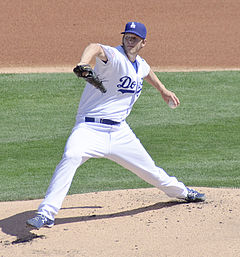
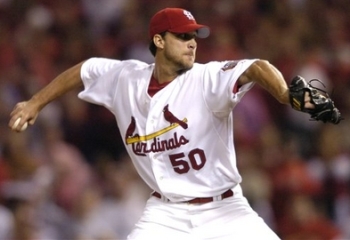
How about Pitching Mechanics? We’ve all heard ad-naseum about the “Inverted W” and people talking about pronation and timing and elbow lift and etc etc. Here’s a quick attempt to analyize the mechanics of each of these 19 guys (all photos grabbed as thumbnails from google images for the purposes of demonstration; no copyright infringement intended).
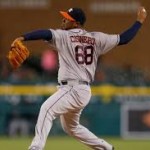
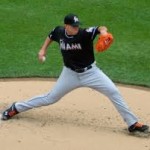
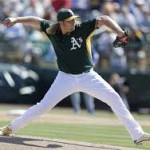
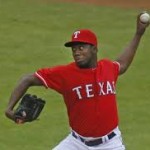

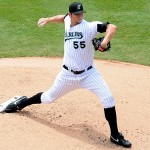

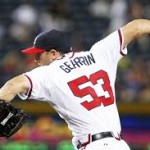
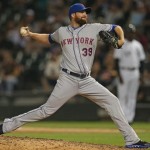


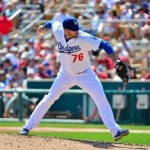
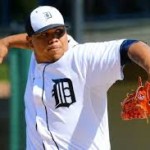

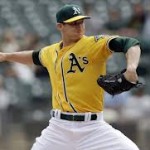

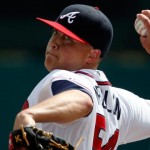


Quick and Dirty Mechanics analysis (images in same order as list of pitchers above, which is choronological in order of diagnosis in 2014):
- Inverted W: Griffin, Nova, Gearrin, Beachy, Hochevar
- Sideways M: Fernandez, Johnson, Davis, Moylan, Rondon, Parker, Medlen
- Inverted L: Cisnero, Figueroa, Moore, Parnell, Hernandez, Corbin, Luebke
But I’ll immediately add a caveat to these classifications; at various stop-points in a guy’s delivery, he may exhibit “good” or “bad” trends. Maybe some of these “sideways-M” guys are actually “inverted-W” guys. Maybe some of these inverted-W guys are ok and the stills make their mechanics seem worse than they are.
Nonetheless; there’s no trend among the 19 guys in terms of their mechanics. In some cases they’re “bad” (Griffin and Gearrin’s look awful) but in some cases excellent (nobody should look at Moore’s mechanics and say they’re anything but clean, nor with Parnell or Corbin). These pitchers are overhanders, 3/4-slot guys and even side-armers/submarine guys (Gearrin and Moylan). These guys include hard throwers (Rondon had the 3rd highest velocity of *any* pitcher in 2013) and softer-throwing guys (Medlen had one of the lowest fastball velocities in the majors in 2013). There’s starters and relievers almost equally represented in this list.
Conclusion; there’s no conclusions to draw from pitching mechanics analysis. I think all attempts to look at guys’ mechanics and make judgements are useless. I think (as does Keith Law and other pundits in the field) that the “Inverted W” is nonesense and that “research” posted online by concerned-fathers-turned-self-appointed-mechanics-experts is not exactly trustworthy. The fact of the matter is this: throwing a baseball over and over is hard on the body. Throwing a ball is an unnatural motion, and throwing a ball at max-effort will eventually lead to pitching injuries, no matter what your mechanics. They can be “good” or “bad” according to someone’s pet theory on bio-mechanics and it has nothing to do about whether a pitcher is going to throw 10 seasons without injury or have two tommy johns before they’re 25.
Some historical context for pitching mechanics arguments: the pitcher who has the 2nd most innings thrown in the non-knuckleballer modern era (behind Nolan Ryan) was Don Sutton. Sutton displayed absolutely *classic* inverted-W mechanics, never hit the D/L in his career and threw nearly 5,300 innings over the course of 23 seasons. Walter Johnson‘s mechanics were awful; he slung the ball sideways as he literally pushed backwards away from the hitter at the end of his delivery. If someone saw Johnson’s mechanics today they’d talk about how over-compensated he was on his shoulder and how he lost velocity thanks to landing stiff and having zero follow through. Johnson only threw 5,900 innings in his pro career; yeah those mechanics really held him back. Nolan Ryan was a freak of nature, throwing at that velocity for as long as he did. The point? You just don’t know.
Maybe there’s something to the “showcase abuse” theory for some players. Maybe there’s something to the travel-ball overuse theory for some kids. But I think the answer may be a bit more simple. We all know there’s been a rise in the average MPH of fastballs in the majors, both on starters and especially with relievers. My theory is simply this: kids who “can” throw upper 90s spend all their time trying to throw upper 90s/max effort fastballs 100% of the time, and human arms just cannot withstand that kind of abuse over and over. In prior generations, kids who “could” throw that hard wouldn’t, or would rarely try to throw that hard, and thus suffered fewer elbow injuries.
Side note: I also firmly believe that we’re “victims of our own success” to a certain extent with respect to modern medicine; 30 years ago would someone have just “blown out their arm” instead of being diagnosed specifically with a “torn ulnar collateral ligament?” Would some kid in the low minors who hurt his harm even bother to get an MRI? How much of the rise in these injuries is simply the fact that we’re better at diagnosing injuries in the modern sports world?
Why are these kids trying to throw so hard these days? Because velocity is king, and that’s what scouts look for. A kid who “only” throws mid 80s as a 17-yr old is dismissed, while the kid who can throw mid 90s at the same age is fawned over. Guys like Greg Maddox, Mark Buehrle, and Tom Glavine probably don’t even get drafted in the modern baseball climate thanks to the over-focus on pure velocity.
You can talk about upbringing and showcase events and pitch counts and mechanics all you want, but I think it comes down to Pitcher over-exertion thanks to the rising trend of fastball velocity and the human nature urge of prospects and farm-hands to show more and more velocity so they can advance their careers.
What do you guys think? Do you dismiss the “inverted-W” arguments like I do? Do you think its all about showcase events?