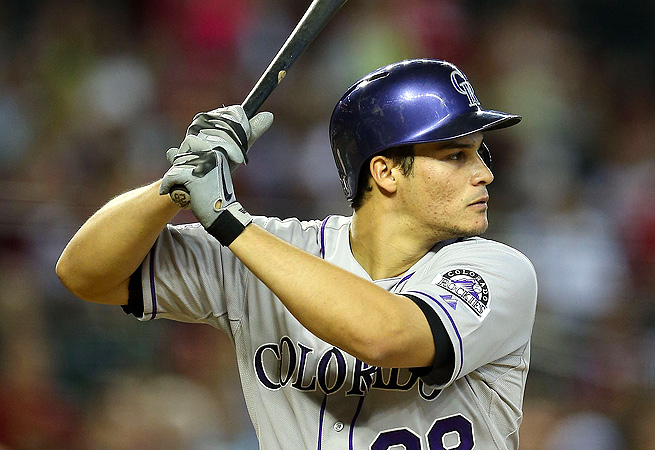
Arenado well represented on these leader boards this year. Photo via legitsports.com
(whoops, forgot to post this earlier this off-season)
Every year I have kept a spreadsheet with each year’s Gold Glove award winners and then shown how the leading advanced statistical measures listed out the best in the league.
Here’s the same post for past years: 2018, 2017, 2016, 2015, 2014, 2013.
In 2019, for the first time in a while, I think the selectors really did an excellent job picking the Gold Glove winners in each league. Of the 18 winners, I think 15 of them were spot-on, inarguable selections. And the 3 that I quibbled with each still led in some statistical categories, or were selected by the blue-ribbon Bill James-led panel of fielding Bible winners. So you’d be hard pressed to even argue that those three were troublesome selections. There’s no Derek Jeter esque selection (he won the Gold Glove in 2005 posting a -27 DRS figure) and no Rafael Palmeiro esque selections (he won the GG in 1999 playing just 28 games in the field and DHing the rest). I feel like the selection committee is really getting good at picking the best defenders in the league.
Here’s your 2019 GG winners:
| Pos | AL GG Winner | NL GG Winner |
|---|---|---|
| C | Roberto Perez | JT Realmudo |
| 1B | Matt Olson | Anthony Rizzo |
| 2B | Yolmer Sanchez | Kolten Wong |
| SS | Francisco Lindor | Nick Ahmed |
| 3B | Matt Chapman | Nolan Arenado |
| LF | Alex Gordon | David Peralta |
| CF | Kevin Kiermaier | Lorenzo Cain |
| RF | Mookie Betts | Cody Bellinger |
| P | Mike Leake | Zack Greinke |
I had quibbles with the following players (along with counter arguments):
- Nick Ahmed: did not lead the NL in Fangraphs all-encompassing Defensive Statistical measure (Paul deJong), nor UZR/150 (Miguel Rojas), but was the top SS in DRS and in Baseball-Reference’s Total Zone. Ahmed was given the Fielding Bible award though (as we’ll see in a moment) but missed out on the Wilson defensive POTY award to Andrelton Simmons (which seemed to be a reputation award).
- David Peralta: This is a very slight quibble; Peralta missed out on officially qualifying for some of the Fangraphs lists by virtue of missing a bunch of time; otherwise he’d have gotten a clean sweep of statistical and named awards. Marcell Ozuna was pretty much #2 across the board in all statistical categories.
- Lorenzo Cain: Cain wasn’t the leader in a single statistical category, but was the Fielding Bible and Wilson POTY. Harrison Bader was the CF leader in both Fangraphs total Defense and UZR/150, while our own Victor Robles ended up leading the qualified DRS candidates in the NL.
Lets look at other fielding awards for 2019:
Fielding Bible
| Pos | Fielding Bible Winner |
|---|---|
| C | Roberto Perez |
| 1B | Matt Olsen |
| 2B | Kolten Wong |
| SS | Nick Ahmed |
| 3B | Matt Chapman |
| LF | David Peralta |
| CF | Lorenzo Cain |
| RF | Cody Bellinger |
| P | Zack Greinke |
| Util | Cody Bellinger |
Every Fielding Bible recipient in 2019 also matched a Gold Glove winner; a first that I can remember.
Wilson Defensive POTY
| Pos | Wilson Defensive POTY |
|---|---|
| C | Roberto Perez |
| 1B | Freddie Freeman |
| 2B | Kolten Wong |
| SS | Andrelton Simmons |
| 3B | Matt Chapman |
| LF | David Peralta |
| CF | Lorenzo Cain |
| RF | Aaron Judge |
| P | Zack Greinke |
Simmons seems like (as i said above) an award based on his reputation for years being the best defender in the league. He’s not that anymore. I’m not sure where the Freddie Freeman award came from; he did not lead any defensive measures in 2019. The Aaron Judge award wasn’t too egregious; he led DRS in the AL, one of two primary defensive stats I like.
Fangraphs DEF stat (for a definition see here: https://library.fangraphs.com/defense/def/); it’s basically a combo state that tries to equate all players into one stat using positional adjustments.
| Pos | AL Fangraphs Stat Avg (Def) | NL Fangraphs Stat Avg (Def) |
|---|---|---|
| C | Christian Vazquez | JT Realmudo |
| 1B | Matt Olson | Anthony Rizzo |
| 2B | Yolmer Sanchez | Kolten Wong |
| SS | Marcus Siemen | Paul DeJong |
| 3B | Matt Chapman | Nolan Arenado |
| LF | Alex Gordon | Marcell Ozuna |
| CF | Kevin Kiermaier | Harrison Bader |
| RF | Mookie Betts | Cody Bellinger |
| P | n/a | n/a |
So, 11 of the 16 GG winners are here, for about 70% match rate. That’s not too bad. A couple of the deltas we’ve already discussed (Ozuna and Bader). Both SS figures resulted in different leaders here versus the GG winners, oddly. But for the most part, this state predicted the GGs well.
Ultimate Zone Rating averaged over 150 games (UZR/150):
| Pos | AL UZR/150 | NL UZR/150 |
|---|---|---|
| C | n/a | n/a |
| 1B | Matt Olson | Anthony Rizzo |
| 2B | Yolmer Sanchez | Kolten Wong |
| SS | Francisco Lindor | Miguel Rojas |
| 3B | Matt Chapman | Nolan Arenado |
| LF | Alex Gordon | Marcell Ozuna |
| CF | Kevin Kiermaier | Harrison Bader |
| RF | Mookie Betts | Cody Bellinger |
| P | n/a | n/a |
This is one of my two go-to defensive stats; it does suffer from Short Sample Sizes so you really need a full season, but the range factor it measures does seem to tell a good story about how much ground the defender covers. Its interesting to go through and look at certain players UZR/150 machinations; when Mike Trout and Bryce Harper were hurt, their UZRs plummeted accordingly.
In 2019, 11 of the 14 GG winners also led their leagues in UZR/150, a great showing. Two of the three outliers are guys we’ve already talked about (Ozuna, Bader).
Defensive Runs Saved (DRS)
| Pos | AL DRS | NL DRS |
|---|---|---|
| C | Roberto Perez | JT Realmudo |
| 1B | Matt Olson | Christian Walker |
| 2B | Yolmer Sanchez | Kolten Wong |
| SS | Willy Adames | Nick Ahmed |
| 3B | Matt Chapman | Josh Donaldson |
| LF | Michael Brantley | David Peralta |
| CF | Kevin Kiermaier | Victor Robles |
| RF | Aaron Judge | Cody Bellinger |
| P | Zack Greinke | Max Fried |
this figure is often the go-to stat for people: I like using it in conjunction with UZR to tell a more complete picture. DRS is context-sensitive; if you (for example) reach over the fence to save a grand slam … you get 4 defensive runs saved added to your total for the year (as opposed to the fact that you just made one out, albeit a tough one). Its an accumulator stat … but its also worth noting that a player can accumulate a lot (or cost his team a lot) in a short amount of time. So often times the DRS leaders don’t technically “qualify” by ABs or percentage of games played like other stats show.
DRS leaders include our own Robles, Josh Donaldson, Judge (in the only stat he led), and have some random players not present on any other stat. So its kind of hard to depend on this stat for the purposes of saying, “So and so was the best defender at his position this year.”
Baseball-Reference total Zone
| Pos | AL Total Zone rTOT | NL Total Zone rTOT |
|---|---|---|
| C | Roberto Perez | JT Realmudo |
| 1B | Yuli Gurriel | Christian Walker |
| 2B | Yolmer Sanchez | Kolten Wong |
| SS | Willy Adames | Nick Ahmed |
| 3B | Matt Chapman | Nolan Arenado |
| LF | Robbie Grossman | David Peralta |
| CF | Mallex Smith | Manuel Margot |
| RF | Aaron Judge | Austin Slater |
| P | n/a | n/a |
This is B-R’s equivalent to Fangraphs total Defense stat … and its always had issues. I’m not sure why. but for 2019, in only was in line with the GG winers half the time, and was the only stat that had a number of players listed as the leader. Its the least dependable advanced defensive stat of those listed here.
Baseball Prospectus FRAA: I gave up on it this year b/c BP has gone to a subscriber model, and you have to be a subscriber in order to get sortable stats on their page.
——–
So that’s it. Not sure if there’s much interest in this stuff but its something I track every eyar so I thought i’d post it.