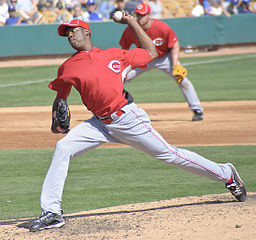
Baseball writer extraordinaire Tom Verducci posted a fantastic article today talking about Neftali Feliz‘s proposed move from the Rangers closer to the starting rotation. The article touches on a topic that I’ve been meaning to write about for a while; Starting versus Closing. It also is literally the best summation I’ve seen yet describing why the save is over-rated, closers are overpaid and why you’d rather have starters versus relievers.
Lets face it; for the most part relievers are failed starters. A few get drafted or signed as relievers (Washington’s Drew Storen being one local example), but most starters are drafted as starters and work their way through the minors as starters. Some starters discover that they can’t develop secondary pitches, but their primary pitches are so fantastic that the club (rightly) turns them into relievers. This especially allows hard-throwers (think someone like Joel Zumaya) to have a career despite the fact that they only really have one pitch and throw with such effort that they could not possibly last 6+ innings.
Minor league relievers definitely make the majors, but most often as either LOOGYs or rubber-armed replaceable right-handers (think Miguel Batista) out of the bullpen. In recent years the desire to have more and faster throwing arms out of the bullpen has led to more pitchers opting to become relievers sooner, but they still are converted out of starting roles for either performance or fragility.
Two items from his story that I’d like to comment on:
1. Managers don’t use Closers in the most high-leverage situations. I could not agree more. When is the best spot to use your best, most reliable reliever? In a one-run game in the 6th when your starter runs out of gas and loads the bases with one out? Or at the beginning of the 9th inning of a 5-3 lead? Verducci is right; managers in the modern game are slaves to the save statistic and will not bring in their closer unless its a “save situation.” But he also notes what is common knowledge; that you could be putting out the 12th man in your bullpen and probably have only a slightly worse chance of getting 3 outs without losing the game for your team. Per the article, 94% of 2-run leads in the 9th inning are won irrespective of who you put out there, and that percentage has not changed significantly over the past 50 years of baseball. Joe Posnanski also wrote about this same topic in November with similar results, finding that teams in the 50s closed out games with the same regularity as teams now, but without high-priced one-inning closers.
Luckily for the Nats, we look to have 3-4 different guys who are of sufficient quality who we CAN bring in to a game in the 6th and get a high-leverage situation. Storen, Clippard, Burnett or newly acquired Henry Rodriguez all seem to fit the bill. But that doesn’t mean that we don’t have a manager in Riggleman who is in the “slave to the save” category. Matt Capps was brought in to be the closer and he closed games. That’s it. It is safe to say that if Riggleman decides on a closer, that’s going to be his role and that’s that.
The save stat is ridiculous and most people know it. You can get a save in a game where you give up 2 runs and 5 hits in a 1/3 of an inning. You can get a save when you perform mop up duty but let the score get too close while you rubber-arm your way through a meaningless blowout. The save takes nothing about the pitcher’s performance into account; only whether or not the game ended while he was on the mound and the win was preserved.
But the save stat, and its monster creation the specialized one-inning closer, are here to stay. Prospects come up through the ranks specifically to be closers, free agent players will only play for certain teams if given “the chance to close.” Closers are well paid, and their pay is directly tied to this flawed save statistic. Statisticians have tried to create a better set of metrics for middle relievers (“Holds” mostly) but the reality is that closers have high leverage in salary situations while middle relievers are lucky to get paid a bit more than the veteran’s minimum. Verducci touches on this ridiculousness, pointing out that Papelbon‘s higher salary in 2011 than Cole Hamels despite the relative levels of production for their teams.
Ironically, some Major League managers *know* this fact, but continue to trot out their best reliever for a 3-out save at the beginning of the 9th inning in a 3-run game. They do the same as the other 29 managers because the radical idea that backfires directly leads to termination. No manager is willing to risk their job to try to do something the right way. To say nothing of the reaction of a highly-paid FA closer who is suddenly told he’s going to be primarily used in the middle of the 7th to clean up the starter’s mess.
It makes you wonder if there’s a better way. Here’s two radical suggestions:
1. Comprise a bullpen with no named closer role, and tell the entire 7-man bullpen they’re doing closer-by-committee. It may infuriate fantasy baseball players and the union (since saves translate to salary for their FAs), but it probably placates an entire roster of wanna-be closers. Imagine if 5 of the 7 guys in your bullpen (leaving out the LOOGY and long-man) know they may be brought in to rescue a game in the 6th or close it out in the 9th, and their roles change on a daily basis based on use. That to me is a far better situation than pre-naming a closer (which invariably is the best guy out there) and then never using him until the 9th.
2. Comprise an ENTIRE pitching staff of long-men relievers. Imagine if you didn’t have starters at all, but an entire bullpen of guys who were geared to pitch 2-3 innings every other night. You would never have a need for specialized closers or even high-priced starters. You’d rotate through who got the start, the starter would go 2-3 innings, then the next guy would go, and you’d repeat this until the game was over. It’s kinda like spring training but all year. Since these guys are only throwing 2-3 innings, they should be able to repeat this task multiple times in a week.
There’s 54 regular innings to be had per week mid-season (6 games at 9 innings per). 54 innings divided out by 12 guys in the pen means about 4.5 innings per WEEK per pitcher. If you split those 4.5 innings up across three games you’d be pitching (say) 2 innings on monday, 1 on thursday then 1.5 on saturday. That’s pretty manageable. Plus if everyone else is doing the same, you can rotate through the guys and slightly adjust based on how they’re pitching that day.
Plus, think about how CHEAP this pitching staff would be. 12 middle relievers could not possibly cost your team more than about $15-20M annually in salary, even if they were mostly on veteran contracts. Roy Halladay makes more than that in 2011 just by himself.
Coincidentally, this is exactly what Tony LaRussa tried at one point in the early 90s with the Athletics. Unfortunately his experiment ended quickly, failing less because of execution and more because of lack of support from his players and management. Its just a matter of time before someone tries it again.
Here’s the second item i’d like to comment on:
2. Starters are FAR more valuable than Relievers or Closers. Last year in the midst of Clippard’s fantastic middle-relief run I asked myself, “Why isn’t Clippard in the rotation?” He pitched 91 innings spread out over 78 appearances and only gave up 69 hits. He maintained an 11.1 K/9 ratio, which is better than any starter in 2010. 91 innings was good for 4th on the entire staff in 2010.
The leading argument i’ve read for Clippard staying in the bullpen relates to the nature of his stuff. He’s got a sneaky good fastball, a decent curve but his bread and butter pitch is the change-up. Apparently the knock on him is that hitters adjust to him more quickly and thus he makes more sense in a relief role. In a starting role hitters would be getting their third crack at him in the 5th or 6th inning, right when he’s tiring and right when he’s vulnerable. In relief, he can “show” all his pitches in one at bat and work each batter individually, then leave the game before his “stuff” is exposed.
Clippard was a starter his entire minor league career, and his minor league numbers were pretty good. He always maintained a small hits-to-IP ratio, a good k/9 ratio. It wasn’t until he reached the majors that suddenly he couldn’t start. I think perhaps he’s either gotten pigeonholed or he’s psychologically set in the reliever mind-frame now.
A quality starter gives your team 6+ innings, works through the opposing team’s batting order nearly 3 full times and keeps your team in the game. 6-7 innings at a 3.00 era is invaluable for your team’s psyche as it tries to win game after game. Leaving just 2-3 innings a night for a bullpen staff of 7 means that there’s fewer days when your staff is over worked and you have to give up games for lack of bullpen arms.
How about using career WAR as a bench mark? I don’t really like the career WAR analysis (since it is an accumulator stat and a mediocre guy with 22 years of experience appears to be better than the best pitcher of his day who only had a 15 year career). But it is telling in this situation. Here’s a link to career WAR for pitchers at baseball-reference.com. And here’s the rank of the 5 best relief pitchers of all time (the 5 relievers currently in the hall of fame), along with the rankings of some of their active contemporaries who seem likely for the hall.
| Lname | Fname | Career WAR Rank |
| Smoltz | John | 38 |
| Eckersley | Dennis | 46 |
| Rivera | Mariano | 69 |
| Wilhelm | Hoyt | 121 |
| Gossage | Goose | 133 |
| Hoffman | Trevor | 215 |
| Wagner | Billy | 238 |
| Sutter | Bruce | 315 |
| Fingers | Rollie | 325 |
Smoltz and Eckersly both started for large portions of their career, hence the high rank. Mariano Rivera is clearly (in my mind) the greatest reliever who has ever played and his career WAR shows. But notice how low closer-only guys like Sutter and Fingers are on this list. Both are currently below modern day starters Ted Lilly and Kevin Millwood, again guys who are hardly listed as being among the game’s elite.
By means of comparison, Trevor Hoffman, who is ranked 215th all time is ranked just ahead of one Freddie Garcia in all time WAR. Now, is Freddie Garcia a serious hall of fame candidate? Not likely; he’s currently on a minor league contract offer with the Yankees after nearly washing out of the game two years ago.
Oh, coincidentally, I absolutely think Felix should be in the rotation. As should Aroldis Chapman in Cincinnati. Because they’ll be able to help your team win on a much more frequent basis. You always want the chance of 180 innings of quality versus 60. Its that simple.

