Nationals Arm Race

"… the reason you win or lose is darn near always the same – pitching.” — Earl Weaver

Archive for the ‘goose gossage’ tag

Ask Collier 6/1/17

21 comments

I've got Harper in the 7th, TKO. Photo via Star Tribune

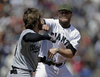
I’ve got Harper in the 7th, TKO. Photo via Star Tribune

This time of year is generally light on pure Nats coverage for me: I like to track local Prep tournaments, I like to track the CWS tourney, and I like to do draft prep.  All of these these things basically hit at the same time between Mid-May and Mid-June.  So bear with me if these aren’t your cup of tea.  I’ll get back to my “where are they now” series soon, as well as more regular stuff on the Nats.

I didn’t even bother to post about the ridiculous Bryce Harper/Hunter Strickland brawl.  I’ll say this: I got a MLB.com app notification on my phone that said simply, “Harper charges the mound in SF” and I immediately said to myself, “Strickland must have hit him.”  So clearly the intent was obvious, and I think personally the right punishment was arrived at (Bryce 3 games for charging the mound, Strickland 6 days for his ridiculous action).

But, I know my readers mostly care about the Nats.  So luckily MLB.com Nats beat reporter Jamal Collier posted an Inbox last night, so I have some Nats content to invent.  Here’s how i’d have answered the questions he took.


Q: Have any reason why Bryce has struggled the past few games? Seems like his batting average and other numbers has taken quite a hit.

A: I’d probably say “regression to the mean.”  Nobody can post a 1.200 OPS for an extended period of time (Harper had a 1.281 OPS in April).  But he’s also been a bit unlucky in May in terms of BABIP (.268), just as he was overly lucky in April (BABIP of .429).  I’m guessing he’ll eventually settle back into a .310-.320 BABIP (he does hit the ball hard, so it shouldn’t be a surprise to see his BABIP regularly higher than league average; his career BABIP is .320) and his numbers will rise back up to impressive levels.

I also notice that he hasn’t missed a game yet; he has sat just one game and got a PH appearance in it (April 24th).  Dusty Baker gives other guys regular rest but Harper hasn’t sat in 6 weeks … maybe he was just starting to drag a bit.  The suspension will be well-timed, especially since it takes him out of the Oakland series (death to hitters).

Collier attributes it to regression as well.

Q: If Glover keeps up his recent dominance, will he stay closer rest of season or do Nats trade for Robertson or Herrera?

A: Well, the question here really should be, “Has the Ownership learned its lesson about fiddling with the closer yet?”  I’m not entirely sure they have; they still seem to buy into the closer narrative, a mind-set that led to them jerking around Drew Storen constantly and demoting him during perhaps his best season.  So will the narrative continue in 2017?  It goes like this: “Gee yeah Koda Glover has been throwing the ball really well, but he’s a rookie so he can’t possibly handle the pressure of October baseball, so we better get the “Proven Closer” and pay out the wazoo for him because that’s what we really need in the playoffs.”

I hate that mindset.  Yes Storen blew a couple of games in the post season; he pitched a grand total of 5 1/3 post-season innings for the Nats across 6 games, and in four of those games he gave up zero runs.  Can  you say “small sample size?”  But to continue to over-react and over-pay for closers is something this team has to stop doing.  Lest I remind everyone of Joe Posnanski‘s research on the topic: teams have won 95% of games they lead in the 9th for about the last 100 years, irrespective of whether they were throwing Joe Schmoe in the 9th in the 40s or Goose Gossage in the 70s or Aroldis Chapman today.

Right now Glover, at league minimum salary, is posting a 200+ ERA+ figure and hasn’t given up a run in a month.  Meanwhile, two of the the three big-money closers on the FA market this past off-season have hit the D/L and have worse seasonal numbers for approximately 30-times the salary.  Which situation would you rather be as a team and a GM?

So; if Glover keeps pitching well (and as long as he’s throwing a 95mph cutter or slider or whatever it is, he should), then leave him there and augment the bullpen at the trade deadline with quality middle relievers who won’t cost as much in terms of prospects.  That’s my suggestion.

Collier thinks the Nats may still get a closer at the trade deadline, and noted (using Storen as an example) that they’ve not hesitated to replace a closer mid-season in the past.  In other words .. he thinks they may go ahead and do something stupid too.

Q: Question for your mailbag: can we expect Albers to revert to his norm? Same for Taylor? (That K rate and BABIP…)

A: Yeah, at some point.  There was a reason Matt Albers was a NRI this past off-season, and there’s a reason Taylor has now had nearly 1,000 major league PAs and is still slashing just .234/.285/.374 for his career.  As far as Albers goes … its ok to have a 6th/7th inning guy who gets blown up every once in a while, as long as those outings are mitigated and don’t really cost you games all that much.  So far, he’s been so much better than expected for us.  Projecting forward, his FIP is a bit higher than his ERA and his BABIP is unsustainably low (.208), so we’ll see some regression back to the mean.  But also there’s this: for as bad as he was in 2016, he was great in 2015.  Who is to say that 2016 was the one-off season and he’s re-gained whatever enabled him to post a 1.21 ERA in 30 appearances for the White Sox?

As for Taylor, I’m not going to re-litigate the whole “Can Michael Taylor turn it around” case.  There’s clearly people dug into the sand on both sides.  His BABIP with his current surge of productivity is .385; that’s all that we need to say.  At some point he’s going to stop having stuff fall in for hits and he’ll regress back to the .230 hitter he’s always been.  Lets just hope Baker is smart enough to keep him in the 8-hole as it happens.  That or recognize it as it happens and think about giving those empty ABs to someone else when it happens.

Collier thinks both players are coming back to earth at some point.

Q: In the time you’ve been covering the Nats, tell us about the value you see JW adding to the team and clubhouse

A: Hard for an armchair psychologist such as myself to give an intelligent answer here.  I know there are many who read this who put little to no value in “clubhouse chemistry,” “team leadership,” and other fuzzy emotional issues when it comes to professional athletes, and I’m fine with that.  I tend to think that clubhouses work like any other workplace team; you have “good” co-workers and “lazy” co-workers, you have respected leaders who have “seen it all” and who have “been around the block” and you have rookies who do dumb things because they just havn’t been around that long.  So in that respect, Jayson Werth should be a valued team-mate who steps up and helps lead the clubhouse, but I have no idea if he actually does.  Its all conjecture on my part, having never stepped into a MLB clubhouse.

Collier says … similar things to what I just said.  Its hard to value leadership.  But he also says (and I agree) that Werth has proven he deserves another contract.  I wonder if it will be with us.


Obligatory 2016 MLB Prediction piece

10 comments

With almost no analysis and just absorbing information from national pundits and stuff I’ve read, here’s my 2016 prediction piece.  Argue at will.

Predicted Division Winners and why:

  • NL East: Washington.  They were better than their final record in 2015  … they’re no longer the favorites so the pressure is off, and they have a manager who knows how to handle a veteran team.  I sense a rebound.  I also think the Mets will struggle with rotation injuries after driving their young arms way too hard last year.  Washington’s offense, defense and intangibles are all improved and their rotation will be better than people give it credit for.  Both teams win 90+ games thanks to their division but Washington nicks them at the end.
  • NL Central: Chicago Cubs: who would pick against them after they won 98 games AND had the best off-season of any team?  What a juggernaut.
  • NL West: San Francisco Giants: somehow the Dodgers continue to have the biggest payroll out there yet can’t find enough healthy starters to fill a rotation.  Arizona improved, but not enough.
  • AL East: Toronto: still the best offense in the land; Tampa and Boston may be frisky.
  • AL Central: Kansas City, though it could be close with Cleveland if KC’s bullpen doesn’t perform like they did last year.  Concerned about the back end of KC’s rotation but they could always make another mid-season move if things get too bad.
  • AL West: Houston again, with Texas nipping on their heels once they get Yu Darvish back.

Wild Cards

  • NL: NY Mets and St. Louis Cardinals: the Mets will beat up on the rest of the weak NL East and get enough wins thanks to unbalanced schedules.  St. Louis goes neck and neck with Chicago all year and settles for the WC.  This leaves Pittsburgh, LA and Arizona out in the cold.  Mentioning literally any other NL team in 2016 as a playoff contender would be shocking thanks to the wide-spread tanking going on in the league.
  • AL: Boston and Texas; not as much tanking in the AL but there are a couple of weak teams in the AL West that help Texas.  Boston is improved.  The AL Central is too good to produce a 2nd team; they’ll beat up on each other all year.

Playoff Results.

  • Mets take the Cardinals in one WC
  • Texas beats Boston in the other WC

In the divisional series:

  • Chicago and New York get a re-match of last year’s NLDS and…. the Mets prevail again in a shocker, defeating the 105-game winning Cubs with ease thanks to the Cubs 15 strike-outs per game against the Mets’ hurlers.  The curse continues.
  • Washington gets revenge on San Francisco, winning games by not taking out starters in the 9th needlessly and handling SF’s all-around solid team.
  • Houston (with the best record in the game) has to face hated rival Texas but wins an intra-state showdown.
  • Kansas City outlasts Toronto but not before Jose Bautista causes another Goose Gossage meltdown with his bat flipping antics.

In the LCS

  • Washington and New York go 7 … having played to a 10-9 seasonal split.  Washington’s arms are healthier in the end and they prevail at home in game 7.
  • Houston ends KC’s AL dominance with a hard fought 6 games series.

In the World Series….

  • Two teams who have never won a WS game go at it.  Washington’s aces shut down Houston’s offense and Washington’s veteran hitters squeak out the hits they need and NL Manager of the Year Dusty Baker leads the team to a WS title in his first season.

What, it could happen couldn’t it??

Written by Todd Boss

April 4th, 2016 at 7:05 am

Starting versus Closing

5 comments

Should we try Clippard as a starter? Absolutely! Photo: NationalsDailyNews/Meaghan Gay/DCist.com

Baseball writer extraordinaire Tom Verducci posted a fantastic article today talking about Neftali Feliz‘s proposed move from the Rangers closer to the starting rotation.  The article touches on a topic that I’ve been meaning to write about for a while; Starting versus Closing.  It also is literally the best summation I’ve seen yet describing why the save is over-rated, closers are overpaid and why you’d rather have starters versus relievers.

Lets face it; for the most part relievers are failed starters.  A few get drafted or signed as relievers (Washington’s Drew Storen being one local example), but most starters are drafted as starters and work their way through the minors as starters.  Some starters discover that they can’t develop secondary pitches, but their primary pitches are so fantastic that the club (rightly) turns them into relievers.  This especially allows hard-throwers (think someone like Joel Zumaya) to have a career despite the fact that they only really have one pitch and throw with such effort that they could not possibly last 6+ innings.

Minor league relievers definitely make the majors, but most often as either LOOGYs or rubber-armed replaceable right-handers (think Miguel Batista) out of the bullpen.  In recent  years the desire to have more and faster throwing arms out of the bullpen has led to more pitchers opting to become relievers sooner, but they still are converted out of starting roles for either performance or fragility.

Two items from his story that I’d like to comment on:

1. Managers don’t use Closers in the most high-leverage situations. I could not agree more.  When is the best spot to use your best, most reliable reliever?  In a one-run game in the 6th when your starter runs out of gas and loads the bases with one out?  Or at the beginning of the 9th inning of a 5-3 lead?  Verducci is right; managers in the modern game are slaves to the save statistic and will not bring in their closer unless its a “save situation.”   But he also notes what is common knowledge; that you could be putting out the 12th man in your bullpen and probably have only a slightly worse chance of getting 3 outs without losing the game for your team.  Per the article, 94% of 2-run leads in the 9th inning are won irrespective of who you put out there, and that percentage has not changed significantly over the past 50 years of baseball.  Joe Posnanski also wrote about this same topic in November with similar results, finding that teams in the 50s closed out games with the same regularity as teams now, but without high-priced one-inning closers.

Luckily for the Nats, we look to have 3-4 different guys who are of sufficient quality who we CAN bring in to a game in the 6th and get a high-leverage situation.  Storen, Clippard, Burnett or newly acquired Henry Rodriguez all seem to fit the bill.  But that doesn’t mean that we don’t have a manager in Riggleman who is in the “slave to the save” category.  Matt Capps was brought in to be the closer and he closed games.  That’s it.  It is safe to say that if Riggleman decides on a closer, that’s going to be his role and that’s that.

The save stat is ridiculous and most people know it.  You can get a save in a game where you give up 2 runs and 5 hits in a 1/3 of an inning.  You can get a save when you perform mop up duty but let the score get too close while you rubber-arm your way through a meaningless blowout.  The save takes nothing about the pitcher’s performance into account; only whether or not the game ended while he was on the mound and the win was preserved.

But the save stat, and its monster creation the specialized one-inning closer, are here to stay.  Prospects come up through the ranks specifically to be closers, free agent players will only play for certain teams if given “the chance to close.”  Closers are well paid, and their pay is directly tied to this flawed save statistic.  Statisticians have tried to create a better set of metrics for middle relievers (“Holds” mostly) but the reality is that closers have high leverage in salary situations while middle relievers are lucky to get paid a bit more than the veteran’s minimum.  Verducci touches on this ridiculousness, pointing out that Papelbon‘s higher salary in 2011 than Cole Hamels despite the relative levels of production for their teams.

Ironically, some Major League managers *know* this fact, but continue to trot out their best reliever for a 3-out save at the beginning of the 9th inning in a 3-run game.  They do the same as the other 29 managers because the radical idea that backfires directly leads to termination.  No manager is willing to risk their job to try to do something the right way.  To say nothing of the reaction of a highly-paid FA closer who is suddenly told he’s going to be primarily used in the middle of the 7th to clean up the starter’s mess.

It makes you wonder if there’s a better way.  Here’s two radical suggestions:

1. Comprise a bullpen with no named closer role, and tell the entire 7-man bullpen they’re doing closer-by-committee.  It may infuriate fantasy baseball players and the union (since saves translate to salary for their FAs), but it probably placates an entire roster of wanna-be closers.  Imagine if 5 of the 7 guys in your bullpen (leaving out the LOOGY and long-man) know they may be brought in to rescue a game in the 6th or close it out in the 9th, and their roles change on a daily basis based on use.  That to me is a far better situation than pre-naming a closer (which invariably is the best guy out there) and then never using him until the 9th.

2. Comprise an ENTIRE pitching staff of long-men relievers.  Imagine if you didn’t have starters at all, but an entire bullpen of guys who were geared to pitch 2-3 innings every other night.  You would never have a need for specialized closers or even high-priced starters.  You’d rotate through who got the start, the starter would go 2-3 innings, then the next guy would go, and you’d repeat this until the game was over.  It’s kinda like spring training but all year.  Since these guys are only throwing 2-3 innings, they should be able to repeat this task multiple times in a week.

There’s 54 regular innings to be had per week mid-season (6 games at 9 innings per).  54 innings divided out by 12 guys in the pen means about 4.5 innings per WEEK per pitcher.  If you split those 4.5 innings up across three games you’d be pitching (say) 2 innings on monday, 1 on thursday then 1.5 on saturday.  That’s pretty manageable.  Plus if everyone else is doing the same, you can rotate through the guys and slightly adjust based on how they’re pitching that day.

Plus, think about how CHEAP this pitching staff would be.  12 middle relievers could not possibly cost your team more than about $15-20M annually in salary, even if they were mostly on veteran contracts.  Roy Halladay makes more than that in 2011 just by himself.

Coincidentally, this is exactly what Tony LaRussa tried at one point in the early 90s with the Athletics.  Unfortunately his experiment ended quickly, failing less because of execution and more because of lack of support from his players and management.  Its just a matter of time before someone tries it again.


Here’s the second item i’d like to comment on:

2. Starters are FAR more valuable than Relievers or Closers.  Last year in the midst of Clippard’s fantastic middle-relief run I asked myself, “Why isn’t Clippard in the rotation?”  He pitched 91 innings spread out over 78 appearances and only gave up 69 hits.  He maintained an 11.1 K/9 ratio, which is better than any starter in 2010.  91 innings was good for 4th on the entire staff in 2010.

The leading argument i’ve read for Clippard staying in the bullpen relates to the nature of his stuff.  He’s got a sneaky good fastball, a decent curve but his bread and butter pitch is the change-up.  Apparently the knock on him is that hitters adjust to him more quickly and thus he makes more sense in a relief role.  In a starting role hitters would be getting their third crack at him in the 5th or 6th inning, right when he’s tiring and right when he’s vulnerable.  In relief, he can “show” all his pitches in one at bat and work each batter individually, then leave the game before his “stuff” is exposed.

Clippard was a starter his entire minor league career, and his minor league numbers were pretty good.  He always maintained a small hits-to-IP ratio, a good k/9 ratio.  It wasn’t until he reached the majors that suddenly he couldn’t start.  I think perhaps he’s either gotten pigeonholed or he’s psychologically set in the reliever mind-frame now.

A quality starter gives your team 6+ innings, works through the opposing team’s batting order nearly 3 full times and keeps your team in the game.  6-7 innings at a 3.00 era is invaluable for your team’s psyche as it tries to win game after game.  Leaving just 2-3 innings a night for a bullpen staff of 7 means that there’s fewer days when your staff is over worked and you have to give up games for lack of bullpen arms.

How about using career WAR as a bench mark?  I don’t really like the career WAR analysis (since it is an accumulator stat and a mediocre guy with 22 years of experience appears to be better than the best pitcher of his day who only had a 15 year career).  But it is telling in this situation.  Here’s a link to career WAR for pitchers at baseball-reference.com.  And here’s the rank of the 5 best relief pitchers of all time (the 5 relievers currently in the hall of fame), along with the rankings of some of their active contemporaries who seem likely for the hall.

Lname Fname Career WAR Rank
Smoltz John 38
Eckersley Dennis 46
Rivera Mariano 69
Wilhelm Hoyt 121
Gossage Goose 133
Hoffman Trevor 215
Wagner Billy 238
Sutter Bruce 315
Fingers Rollie 325

Smoltz and Eckersly both started for large portions of their career, hence the high rank.  Mariano Rivera is clearly (in my mind) the greatest reliever who has ever played and his career WAR shows.  But notice how low closer-only guys like Sutter and Fingers are on this list.  Both are currently below modern day starters Ted Lilly and Kevin Millwood, again guys who are hardly listed as being among the game’s elite.

By means of comparison, Trevor Hoffman, who is ranked 215th all time is ranked just ahead of one Freddie Garcia in all time WAR.  Now, is Freddie Garcia a serious hall of fame candidate?  Not likely; he’s currently on a minor league contract offer with the Yankees after nearly washing out of the game two years ago.


Oh, coincidentally, I absolutely think Felix should be in the rotation.  As should Aroldis Chapman in Cincinnati.  Because they’ll be able to help your team win on a much more frequent basis.  You always want the chance of 180 innings of quality versus 60.  Its that simple.

Did Chapman really throw a ball 105mph?

one comment

Chapman is amazing. Photo via wiki/flickr SD Dirk

Chapman is amazing. Photo via wiki/flickr SD Dirk

(Editor’s Note: Originally published on 9/2/2010, edited several times since, including links to the 105.1 pitch later in 2010 and him hitting 105.1 again in 2016).

If you believe twitter and these published reports, Cincinnati’s Cuban prospect Aroldis Chapman “sat” at 103 and hit 105mph in his final AAA appearance before getting called up for the 9/1/2010 roster expansion.  I had a hard time believing it; the picture in the Yahoo looks doctored frankly, and stadium guns are notoriously “jacked up” to get the crowds excited and to spark interest in hard throwers.

There are two kinds of radar guns used by stadiums and scouts today.  A “fast” gun measures the speed of the pitch as it leaves the hand of the hurler while a “slow” gun measures its speed by the time the pitch crosses the plate.  For obvious reasons you’ll take the “fast” reading if you’re trying to hype the player, and you take the “slow” reading if you’re trying to evaluate the pitcher.  Oh, and you take readings over and again, compare first inning to last inning, etc.  My thoughts were that Chapman was on a fast gun that was over-exaggerated to add a couple MPHs (case in point; Jordan Zimmermann‘s radar readings on the telecast two nights ago put him at 96mph when his pitch f/x maximum was 94).  Click here for an excellent overview of the way we’ve measured velocity has changed over the years.

Now, that being said, check out the Pitch F/X data from Chapman’s first appearance in the majors on 8/31/2010, and his second appearance on 9/1/10. In his major league debut he threw 6 fastballs with an average of 100.65 and a max of 102.7mph.  This in and among itself would have been amazing and would have tied the fastest ever recorded pitch f/x data (that of Joel Zumaya hitting 102.7 in a game in June 2009)

However, look at the data from 9/1/10. He threw 7 fastballs that AVERAGED 102.11 mph with a peak of 103.9mph.  103.9!!  Now, I know there’s a ton of links out there talking about what the fastest ever reported pitch is on record (see links here or here at HardBalltimes or this google cache’d document as well as wikipedia or Guinness Book of World records links).  Nolan Ryan‘s “record” of 100.9mph has stood as some sort of altar to the speed ratings for years and years.  You’ll see radar gun readings as evidence that various players have thrown the ball 102, 104, whatever.  Steve Dalkowski and Bob Feller being “recorded” using primitive measures in the 107 or 110 range.   Walter Johnson was known for his power in the early part of the century; his fastball was estimated to be in the upper 90s by lore, and 91mph by testing.  Its a shame that modern technology didn’t exist back then.

So, what is the “proof” that Feller threw 107.6 in 1946?  Well, its complicated.  This ESPN article covers it: basically Feller threw a ball through a Lumiline Chronograph device, which hyper-accurately measured speed at the time.  His best measure was 98.6mph … but modern pitches are measured at the point of release, not where it crosses the plate.  So, you have to estimate how much velocity was lost from the point Feller tossed the ball to the device.  If you look at the photo (in the ESPN article), Feller was not throwing from the mound, but somewhere well forward of it.  So, to standardize speeds to some point closer to the release point of the pitch, we have to estimate the percentage loss of Feller’s pitch from an estimated delivery point based on a photo, then back into a number.  Some estimate this to be in the 103 range, others claim 107.6, which would imply he was throwing off the mound and experiencing the full expected velocity loss (which is clearly not true from the photo).  So I’d believe Feller was throwing roughly 103-104 based on where he released the ball … but its an estimate.  Add back 1mph for every 7 feet, and Feller seems to be standing at about 35 feet, so add perhaps 5mph to his 98.6 and you get the 103-104 rough estimate.

Coincidentally; the new standard is speed of the pitch measured at 50 feet from home plate.  This standardizes to allow for different release points by pitchers of different heights.

How about proof that Ryan threw 108.1, as is throw around the internet?  Well, It comes from the famous 100.9 reading he put up in a start in 1974.  However, that was reading was made using technology that, again, measured the speed closer to the plate than we currently do.  Per this article (which summarizes findings from a documentary called Fastball), the radar technology measured 100.9 ten feet from home plate, meaning we have to back up to the 50 feet estimate.  So, if the speed was measured at 10 feet, and we normally measure at 50 feet, we should add back “40 feet” of velocity loss, at around 1mph per every 7 feet, so call it somewhere between 5-6 mph … and we’re somewhere in the range of 106-107mph.  Not 108.1 as everyone claims; that’s adding back too much velocity and/or giving Ryan 10 feet more of credit (the measurement at the plate versus 10 feet in front).  These are still estimates of course; these speeds are also affected by the weather at the time (it was in Sept of 1974 in Anaheim … was that a humid day, an arid day?  Anaheim’s typical September weather is humid, hot; was it really humid that night?  Was it relatively dry?  That makes a huge difference in aerodynamics of a baseball and potential velocity loss.  So … we’ll never know.

Coincidentally, these velocity loss estimates are best documented by a physicist at the University of Illinois named Dr. Alan Nathan.  He estimates that baseball pitches lose 9-10% of their velocity from the point of release to the plate.  Example; if you release a ball at 100mph, it will generally measure at 90-91 by the time it crosses home plate.  Or, to put it easier … a pitch loses about 1MPH every 7 feet.

(Side Note: if you’ve never heard of Dalkowski … his wikipedia page is a pretty good read).

Other rumors and records for fast pitches suffer from perhaps hype and estimates, not science.  Zumaya reportedly hit 104.8 in the first game of the 2006 ALCS, but it was on the stadium gun, not Pitch F/X.  Ryan and Goose Gossage both reportedly hit 103mph in the 1978 All-Star game.  Stephen Strasburg reportedly could hit 102 as an amateur but rarely goes about 97 post-arm injury.  Justin Verlander may not have the triple-digit records but amazingly maintains his upper-90s throughout games, often hitting 100mph in his last inning of work.

I think Chapman’s speed last night is the new standard.  And a pretty amazing accomplishment.

(Editors notes: Chapman set a new MLB record on 9/24/10, after this article’s initial posting, throwing a documented 105.1mph.  He also threw a ball at 104.6 on 7/28/14.  Not quite as fast as his best ever … which I’m guessing even Chapman doesn’t think he’ll ever beat, since he got the reading tattooed on his wrist.  Then on 7/19/16,  years after his first record, he tied it again, throwing another ball 105.1.  Here’s the StatCast link for this pitch.  Coincidentally, this 105.1 pitch is now officially registered at 105.8 by MLB, because the technology we use now standardizes the pitch speeds at a specific distiance, and Chapman’s 105.1 was measured further down from where we now standardize.

Post-posting related link: BA’s J.J. Cooper posted this Q&A session on 4/28/15 talking about Chapman and 101+ MPH pitches.

Jan 2017: Boston pitching prospect Michael Kopech, who is renowned his velocity, hit 110 MPH during a “max velocity” workout early in spring training by crow hopping.  Impressive, but not the same as throwing off a mound.  Holy mackerel!  How long before this kid gets to the majors and has a gun on him??

May 2018: we may have a new gold standard; Jordan Hicks threw a reported 105.1 MPH fastball, but Pitch FX shows it at 106.1.  (Unfortunately the PitchFX data at BrooksBaseball site now does not work, so my “evidence”is gone).  However, subsequent reporting on this pitch have lowered it to the mid 104s, so it remains unclear what its real velocity was to this day.

May 2022: University of Tennessee’s Ben  Joyce threw a pitch recorded at 105.5 in a college game.  Does Tennessee have Pitchfx?  Was this a juiced gun?  We’ll have to see.

Written by Todd Boss

September 2nd, 2010 at 12:21 pm