Nationals Arm Race

"… the reason you win or lose is darn near always the same – pitching.” — Earl Weaver

Archive for the ‘kevin kiermaier’ tag

Another Year … another set of crummy Gold Glove picks

11 comments

I guess we should just pencil in Molina's name every year until he retires. Photo via wikipedia

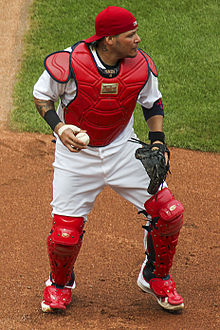
I guess we should just pencil in Molina’s name every year until he retires. Photo via wikipedia

The winners of the 2018 Gold Gloves were announced on 11/4/18 … and once again, there’s a slew of poor selections among the winners when you look at the league leaders of defensive metrics.

Here’s the 2018 Gold Glove Winners:

PosAL GG WinnerNL GG Winner
CSalvador PerezYadier Molina
1BMatt OlsonAntony Rizzo/Freddie Freeman
2BIan KinslerDJ LeMahieu
SSAndrelton SimmonsNick Ahmed
3BMatt ChapmanNolan Arenado
LFAlex GordonCorey Dickerson
CFJackie Bradley Jr.Ender Inciarte
RFMookie BettsNick Markakis
PDallas KeuchelZack Greinke

Of these 18 winners, I’ve got problems with at least 5 of them.

  • Yadier Molina: wins his 9th Gold Glove, yet he was not the NL leader by any C statistical measure, nor was he the Fielding Bible catcher selection for 2018.   Wilson Contreras was the NL leader in Fangraphs total defense stat and in Baseball-Reference’s Total Zone, while Jeff Mathis was the NL leader in DRS and FRAA.  Molina actually posted a NEGATIVE DRS, and was ranked 11th in the NL among catchers with more than 500 innings (i.e. basically full time catchers).   He posted the DRS figure as the Nationals’ Matt Wieters, who nobody in the majors is claiming to be a fine defensive catcher.  This was clearly a “reputation selection” for a guy who yes at one time was inarguably the best defensive catcher in the sport, but who just played his age 35 year and has no business winning a Gold Glove over other more deserving candidates.
  • DJ LeMahieu wins his third Gold Glove, yet was flatly outshined by the Cardinals’ Kolten Wong, who nearly swept the defensive metrics.  Wong was the NL leader in Fangraphs total defense, UZR/150, and DRS, LeMahieu was the league leader in FRAA and Baseball Reference’s total Zone, which honestly are the two weakest defensive metrics.  It isn’t that LeMahieu isn’t good: he was 2nd to Wong in the three categories Wong led … but the award should go to the winner.  Wong was the Fielding Bible award winner for good reason.
  • Jackie Bradley, Jr: wins his first Gold Glove, but was selected over an obvious candidate.  Kevin Kiermaier may have only played 88 games this year, but in those 88 games he put up league-leading numbers in DRS. UZR/150 and Fangraphs total defense; imagine what he would have done in a full season.  In fact, this seems to be the one thing working against Kiermaier (the 2016 Gold Glove winner): he missed out in both 2017 and 2018 thanks to not qualifying for the batting title (an odd statement for a fielding award).  Bradley Jr. showed great range (he was near the league leaders in UZR) but actually had negative DRS.   In the end, Bradley was probably the deserving choice of players who didn’t miss half the season, so my nits are slight here.
  • Ender Inciarte: wins his 3rd GG, and this might also be a “reputation award” because the NL had at least two more deserving candidates.  Lorenzo Cain was the Fielding Bible award winner, and led the NL in Fangraphs total Defense and DRS.  Harrison Bader led the league in UZR/150 and FRAA.  Inciarte was second to Cain across the board among qualified CFs … so why wasn’t he the winner?
  • Nick Markakis wins his third GG … in somewhat of a “down year” for NL right fielders.  Its hard to say who the deserving winner here was: Yasiel Puig led qualified (and all) RFs in DRS, Jason Heyward led in the two iffy stats FRAA and B-R’s total zone.  Markakis posted just barely positive figures for both DRS and UZR/150, and there’s only 6 “qualified” RFs on the list … so I guess Markakis isn’t the worst possible choice.  Bryce Harper, coincidentally, had an abhorrent year defensively.  Which is really weird, because last year he posted BETTER numbers across the board than those that just won Markakis a Gold Glove.  It almost makes you wonder if Harper wasn’t nursing yet another hidden injury all year.  Or maybe he was just 100% disgruntled and not trying (he certainly hit like it)  But I digress.

Here’s a series of tables showing the league leaders by various other fielding measures:

PosFielding Bible Winner
CJeff Mathis
1BMatt Olson
2BKolten Wong
SSAndrelton Simmons
3BMatt Chapman
LFAlex Gordon
CFLorenzo Cain
RFMookie Betts
PZack Greinke
UtilJavier Baez

The Fielding Bible awards are a part stat, part committee-led selection process spearheaded by Bill James (yes the same Bill James who said that all players were replaceable. Great take for an employee of a MLB ball-club).  And the Gold Glove awards managed to miss fully 1/3rd of the FB awardees this year.

PosAL Fangraphs Stat Avg (Def)NL Fangraphs Stat Avg (Def)
CSalvador PerezWilson Contreras
1BMatt OlsonFreddie Freeman
2BIan KinslerKolton Wong
SSAndrelton SimmonsPaul deJong
3BMatt ChapmanNolan Arenado
LFAlex GordonKyle Schwarber
CFKevin KiermaierLorenzo Cain
RFMookie BettsIsaac Galloway
Pn/an/a

This table is the Fangraphs Defense Runs Above Average stat, a combination of DRS and UZR that attempts to get the best of both worlds of the individual defense stats.  DEF aligned the best with the GG Winners, matching up 56% of the time.

PosAL UZR/150NL UZR/150
Cn/an/a
1BMatt OlsonBrandon Belt
2BJoey WendleKolton Wong
SSAndrelton SimmonsMiguel Rojas
3BMatt ChapmanJohan Camargo
LFAlex GordonKyle Schwarber
CFKevin KiermaierHarrison Bader
RFMookie BettsChristian Yelich
Pn/an/a

This table is the UZR/150 leaders.  UZR is a range factor stat,normalized to 150 games to take out small sample sizes, and I’ve limited the leaders to those who played at least 500 innings this year at the position in question.  Its not a counting stat so it can be skewed if a fleet-of-foot player makes a ton of flashy plays.  Interestingly, UZR/150 did a great job predicting the AL gold glove winners … but did not align with a SINGLE NL winner.  I also found it fascinating that the NL leader for left fielders was none other than Kyle Schwarber who has been frequently denigrated for his lack of defensive prowness.  Well, stats don’t lie; maybe its time to re-think the Chicago slugger’s contributions.

PosAL DRSNL DRS
CMike ZuninoJeff Mathis
1BMatt OlsonBrandon Belt
2BIan KinslerKolton Wong
SSAndrelton SimmonsNick Ahmed
3BMatt ChapmanTravis Shaw
LFAlex GordonAdam Duvall
CFKevin KiermaierLorenzo Cain
RFMookie BettsYasiel Puig
PZack GreinkeLuis Severino

This table shows league leaders in DRS; Defensive Runs Saved.  Its a counting stat, so the more innings you play the more you can accumulate.  And, its a contextually driven stat, which can result in some random skewing.  For example; lets say you reach over the fence and catch a potential home run with the bases loaded; this results in 4 DRS.  But all you did was make one fly ball catch of slight but not exceedingly extensive difficulty.  This leads to some wild variations in DRS for some players.  For example; Mike Trout (widely considered to be a fantastic CFer) has posted these full season DRS figures in his career: 21, -11, -12, 5, 6, -6 and 8 in 2018.  So, who is Mike Trout the center fielder?  Is he the guy who posted a 21 DRS in 2012 (an amazingly good figure), or the guy who posted consecutive seasons of -11 and -12 the next two years (pretty bad), or the guy who posted an 8 DRS in 2018 (good enough for 5th among qualified CFers, but just 12th in baseball among all CFers for the year and behind our own Michael A. Taylor, who put up 10 DRS in part time duty).  I dunno.  This is why you look at multiple defensive stats.

PosAL FRAANL FRAA
CMax StassiJeff Mathis
1BAlbert PujolsAnthony Rizzo
2BRougned OdorDJ LeMahieu
SSMarcus SemienBrandon Crawford
3BMatt ChapmanJustin Turner
LFJustin UptonCorey Dickerson
CFLeonys MartinHarrison Bader
RFAaron JudgeJason Heyward
PMarcus StromanClayton Richardson

This table shows the Baseball Prospectus Fielding Runs Above Average, which tries to roll all the metrics and defensive contextualization into one stat.  This stat routinely does the worst job predicting Gold Gloves; this year it matched up with just 4 of the 18 GG winners.

PosAL Total Zone rTOTNL Total Zone rTOT
CSalvador PerezWillson Contreras
1BMatt OlsonBrandon Belt
2BJoey WendleDJ LeMahieu
SSCarlos CorreaNick Ahmed
3BMatt ChapmanNolan Arenado
LFAndrew BenintendiCorey Dickerson
CFJackie Bradley Jr.Starling Marte
RFMookie BettsJason Heyward
Pn/an/a

The last table here shows Baseball-Reference.com’s attempt at a defensive stat; one called Total Zone.  They’re really hard to find on their main page, but they’re there.  This stat tries to create a “runs above average” based on plays made combining the output of several other defensive rate stats.  But something seems amiss with this stat: the three AL outfielder leaders for the FRAA defensive metric ALL played in Boston.   Andrew Benintendi, Bradley and Betts swept the lead.  Is there something weird about Fenway that lead FRAA to get skewed results or is this a coincidence?  Might be a coincidence since Bradley and Betts are both league-best calibre defensive players, but its also worth noting that two of the three FRAA leaders in the NL outfield play in Pittsburgh.   FRAA also wildly overrates Catcher defense; most of the guys in the top 20 are catchers.


I know defensive stats are not perfect.  Which makes WAR figures imperfect as well.  But they’re the best we have, and looking across all of them gives the best viewpoint into ranking and evaluating defenders.  I just wish the people voting on these awards did the same.


Gold Glove Awards versus Defensive Metrics Review for 2015

one comment

Andrelton Simmons was completely hosed in the GG awards in 2015. Photo via espn.go.com

Andrelton Simmons was completely hosed in the GG awards in 2015. Photo via espn.go.com

Third year running for this post, looking at the announced winners of the Gold Gloves for 2015 and comparing them to the Fielding Bible winners for 2015 and the leaders of various defensive metrics available to us.  For a glossary of the metrics, see the end of the post.

Here’s 2014’s post and 2013’s post as well.

Here’s a Google XLS link to all of this data in one sheet.  Also available in the Links section to the right.

First off, here’s the announced winners of the 2015 Gold Glove awards (bold is a repeat winner from last year, red is a questionable selection)

Pos AL GG Winner NL GG Winner
C Salvator Perez, KC Yadier Molina, Stl
1B Eric Hosmer, KC Paul Goldschmidt, Ari
2B Jose Altuve, Hou Dee Gordon, Mia
SS Alcides Escobar, KC Brandon Crawford, SF
3B Manny Machado, Bal Nolan Arenado, Col
LF Yoenis Cespedes, Det/NYM Starling Marte, Pit
CF Kevin Kiermaier, TB A.J. Pollack, Ari
RF Kole Calhoun, LAA Jason Heyward, Stl
P Dallas Keuchel, HOU Zack Greinke, LAD

There are a couple of other “repeat” winners in here (as in guys who have won awards previously, just not in 2014), namely Manny Machado and Paul Goldschmidt.

So, why are we calling Jose Altuve, Alcides Escobar, Yadier Molina and (especially) Brandon Crawford questionable selections?   Read on.  We’ll pass some judgement at the end.


Here’s the Fielding Bible winners for 2015: (bolded are repeat winners, green throughout are also GG winners)

Pos Fielding Bible Winner
C Buster Posey, SF
1B Paul Goldschmidt, Ari (2nd award)
2B Ian Kinsler, Det
SS Andrelton Simmons, ATL (repeat, unanimous)
3B Nolan Arenado, Col
LF Starling Marte, Pit
CF Kevin Kiermaier, TB (unanimous)
RF Jason Heyward, Stl (repeat, Unanimous)
P Dallas Keuchel, HOU (repeat)
Util Ender Inciarte, KC

So, Andrelton Simmons is a unanimous choice of a blue-ribbon panel yet doesn’t win the Gold Glove?  Likewise, Kinsler and Posey are selected but neither got the Gold Glove.  Simmons is probably the biggest mistake in the Gold Glove awards, but lets dig into the stats to see what happened.


Now lets start in with the defensive metrics.  First: UZR/150.

Pos AL UZR/150 NL UZR/150
C n/a n/a
1B Mitch Moreland, Tex (6.4) Brandon Belt, SF (10.7)
2B Ian Kinsler, Det (6.7) Dee Gordon, Mia (6.0)
SS J.J. Hardy, Bal (10.1) Adeiny Hechavarria, Mia (17.7)
3B Adrian Beltre, Tex (13.0) Matt Duffy, SF (12.7)
LF Yoenis Cespedes (22.2) Starling Marte, Pit (12.1)
CF Kevin Kiermaier, TB (42) A.J. Pollack, Ari (14)
RF Kole Calhoun, LAA (12.1) Jason Heyward, Stl (22.3)
P n/a n/a

We see some consistency here with the players named in the Gold Gloves and/or the Fielding Bible awards.   7 of the 14 leaders here also won Gold Gloves, and 4 of the 10 leaders here won Fielding Bible awards.  You’re going to see the same outfield names over and over; that’s how dominant this selection of outfielders were this year.  Ian Kinsler represents one of the bigger snubs in the Gold Glove awards, as we’re about to see.


Here’s Defensive Runs Saved

Pos AL DRS NL DRS
C
1B Adam Lind, Mil (5) Paul Goldschmidt, Ari (18)
2B Ian Kinsler, Det (19) Dee Gordon, Mia (13)
SS Didi Gregorius (5) Andrelton Simmons, ATL (25)
3B Adrian Beltre, Tex (18) Nolan Arenado, Col (18)
LF Yoenis Cespedes (15) Starling Marte, Pit (24)
CF Kevin Kiermaier, TB (40.7) Billy Hamilton, Cin (18.8)
RF Kole Calhoun, LAA (6) Jason Heyward, Stl (22)
P Dallas Keuchel, HOU (13) Zack Greinke, LAD (9)

These are definitely closer to the Gold Gloves.   10 of the 16 league leaders here also won GGs.  A note here; the Kiermaier DRS figure is apparently the highest ever recorded by a fielder in a single season.  Simmons’ 25 DRS dwarfed the field, as does his overall DRS figure over the last three years, more evidence that the GG award to Crawford was poor.


Here’s FRAA:

Pos AL FRAA NL FRAA
C Francisco Cervelli, NYY (11.7) Yasmani Grandal (20.9)
1B Mark Canha, Oak (5.8) Paul Goldschmidt, Ari (13.0)
2B Roughned Odor, Tex (5.0) Danny Espinosa (10.7)
SS Elvis Andrus, Tex (10.3) Jean Segura (10.3)
3B Manny Machado, Bal (20.3) Nolan Arenado, Col (20.6)
LF Kevin Pillar, Tor (14.3) Yoenis Cespedes (5.2)
CF Kevin Kiermaier, TB (24.6) Ender Inciarte, Ari (5.9)
RF Kole Calhoun, LAA (9.5) Jason Heyward, Stl (11.4)
P Dallas Keuchel, HOU (10.4) Jake Arrieta, Chc (7.4)

Just 8 of the 18 leaders in this stat also won Gold Gloves, and the presence especially of the Nats’ own Danny Espinosa really calls this stat into question.  How is Espinosa, a part time player, the league leader here in a year where there were several other good 2nd basemen?


Lastly, Total Zone

Pos AL Total Zone Total Fielding NL Total Zone Total Fielding
C James McCann, Cle (11) Wilson Ramos, Was (11)
1B Mike Napoli (10) Adrian Gonzalez, LAD (16)
2B Jose Altuve, Hou (13) Neil Walker, Pit (7)
SS Francisco Lindor, Cle (14) Brandon Crawford, SF (19)
3B Evan Longoria, TB (14) Jake Lamb, Ari (10)
LF Yoenis Cespedes, Det (11) Christian Yelich, Mia (12)
CF Kevin Kiermaier, TB (24) A.J. Pollack, Ari (20)
RF Kole Calhoun, LAA (17) Ichiro Suzuki, Mia (14)
P

Its easy to see w here some of the finalists came from in the GG awards, since this is the only list that GG finalist Wilson Ramos appears on.  Its also the only place where GG winners Altuve and Crawford appear.  Just 6 of these 18 leaders also won GGs, meaning its the least accurate predictor of GG winners.  And one of the leaders in practically every other category (Heyward) is supplanted by the 40-yr old Suzuki in these stats.  Makes you wonder.

Conclusion:

It seems to me that the “statistical”component of the Gold Gloves is using the wrong stats (FRAA and/or TZ), and that it should be using DRS and UZR/150.  Even so, as noted elsewhere, the Gold Gloves are doing a much, much better job selecting the award winners on a whole, and the days of awarding them to the likes of Derek Jeter or Rafael Palmeiro seem long gone.


Glossary of these various stats and awards

  • Gold Gloves: awarded annually (presented by Rawlings) and are a combination of Manager/Coach voting and a “statistical component.”  This component is provided by SABR and is now 25% of the voting.  I cannot find details on what comprises this statistical component, but based on the finalists announced I strongly believe it is related to the Total Zone fielding measurements.
  • Fielding Bible Awards: Bill James-driven website that uses a committee of national writers to select the winners.  The site is here and you can read about their methodology and panel members.
  • UZR: Ultimate Zone Rating, defined well here at fangraphs, attempts to be a comprehensive measure of how many batted balls are turned to outs for a particular fielder, then adjusted by errors, arm and other factors.  UZR/150 standardizes the counting stat UZR to an average across 150 games to allow apples-to-apples comparisons of players who play different numbers of games in a season.
  • DRS; Defensive Runs Saved, defined well here at Fangraphs, focuses more on pure “runs saved” from all possible defensive plays that involve a fielder.  It seems to measure more things that UZR and sometimes disagrees with UZR.
  • FRAA: Fielding Runs Above Average, defined here at Baseball Prospectus.  A measure that attempts to remove the bias present in zone-based data and also tries to factor in the tendencies of the pitcher on the mound (ground-ball guy, fly-ball guy, etc).
  • Total Zone: defined here at Baseball-reference.com.  A different “total defense” measurement incorporating all the various defensive data available, including catcher data, zone fielding, errors, arm, etc.

Gold Glove Awards versus Defensive Metrics Review for 2014

leave a comment

Alex Gordon was one of the best defensive players in baseball, by any measure in 2014.  photo 365rundown.com

Alex Gordon was one of the best defensive players in baseball, by any measure in 2014. photo 365rundown.com

Last year, I created a little spreadsheet upon the announcement of the Gold Glove winners, to see how they compared to various defensive metric leaders (2013 xls link here).  And I threw in the “Fielding Bible” award winners, since that has now taken over as the “accepted” list of the year’s best defensive players, thanks to the Gold Gloves continuing to pick inexplicable players (this  year’s repeat “I cannot believe he won” player again being Adam Jones).  But, as we’ve seen, the Gold Gloves are getting better, and the days of picking someone like a statue-esque Derek Jeter and/or a nearly permanent DH in Rafael Palmeiro seem to now be over.

So, now that we’ve announced the 2014 Gold Glove winners, lets also look at the league leaders in various defensive metrics.

This data is in the following spreadsheet for 2014 on Google Docs.

First, your 2014 Gold Glove winners: bold are also Fielding Bible winners, and red are the most egregiously bad selections.

Pos AL GG Winner NL GG Winner
C Salvator Perez, CLE Yadier Molina, STL
1B Eric Hosmer, KC Adrian Gonzalez, LAD
2B Dustin Pedroia, BOS DJ LeMahieu, COL
SS J.J. Hardy, BAL Andrelton Simmons, ATL
3B Kyle Seager, SEA Nolan Arenado, COL
LF Alex Gordon, KC Christian Yelich, MIA
CF Adam Jones, BAL Juan Lagares, NYM
RF Nick Markakis, BAL Jason Heyward, ATL
P Dallas Keuchel, HOU Zack Greinke, LAD

As with last year, the league still remains obsessed with Adam Jones despite his possessing negative defensive rankings across the board.  Kyle Seager wasn’t “bad” but wasn’t nearly as deserving as Josh Donaldson.  The only other real “bad” selection was Molina, not because he’s not a great defensive catcher (he is), but because he missed a ton of time and there were better options in the NL this year (namely, Jonathan Lucroy).  Otherwise every Gold Glove winner listed here was deserving.

Repeat Gold Glove winners from last  year: Molina, Hosmer, Pedroia, Hardy, Simmons, Arenado, Gordon, and Jones.  So, 8 of 18.

Here’s the 2014 Fielding Bible Awards, which (if you’re not aware) is a Bill James-driven website that uses a committee of national writers to select the winners (the site is here and you can read about their methodology).  Bolded are also GG winners:

Pos 2014 Fielding Bible Winner
C Jonathan Lucroy, MIL
1B Adrian Gonzalez, LAD
2B Dustin Pedroia, BOS (repeat)
SS Andrelton Simmons, ATL (repeat)
3B Josh Donaldson, OAK
LF Alex Gordon, KC (repeat)
CF Juan Lagares, NYM
RF Jason Heyward, ATL
P Dallas Keuchel, HOU
Util Lorenzo Cain, KC

They selected Lucroy over Molina, and Donaldson over Seager.  They’ve also added a 10th position for “Utility,” to recognize the excellent work of Lorenzo Cain playing multiple outfield positions.

Now, here’s the league leaders by various defensive stats.  The links to get any of these leaderboards are in the Google xls.  First: UZR/150.

Pos AL UZR/150 NL UZR/150
C
1B Albert Pujols, LAA (9.3) Anthony Rizzo, CHC (8.2)
2B Dustin Pedroia, BOS (20.4) DJ LeMahieu, COL (11.0)
SS J.J. Hardy, BAL (15.4) Andrelton Simmons, ATL (18.4)
3B Josh Donaldson, OAK (13.3) Todd Frazier, CIN (8.9)
LF Alex Gordon, KC (22.6) Christian Yelich, MIA (14.1)
CF Jackie Bradley JR, BOS (22.6) Juan Lagares, NYM (25.3)
RF Nori Aoki, KC (7.7) Jason Heyward, ATL (20.5)
P

I like UZR as a measure and use it often. UZR/150 somewhat standardizes the scores across a 150-game average to represent the figure for a full-season for apples-to-apples comparisons.  A good number of these leaders also earned Gold Gloves and/or Fielding Bible awards.  Josh Donaldson was the clear AL 3B leader.  Otherwise there’s a lot of similarities to the lists we’ve already seen.  I was surprised as heck to see Albert Pujols on this leader board.

For a quick point of reference to the above scores, the BEST UZR/150 of any Nationals player this year was Anthony Rendon‘s uZR/150 of 4.6 while playing 3B.  Span and LaRoche (our two GG finalists) both scored *negative* UZR/150 scores … perhaps an indictment of their nominations in general as being based on reputation and not actual on-field performance this year.

Next: DRS; Defensive Runs Saved.  Some like this stat a lot; I struggle with it because single plays (like an outfielder reaching over the wall to take away a homer) result in huge swings in the numbers on plays that aren’t necessarily the hardest to make.

Pos AL DRS NL DRS
C
1B Chris Davis, BAL (8) Adrian Gonzalez, LAD (12)
2B Ian Kinsler, DET (20) DJ LeMahieu, COL (16)
SS J.J. Hardy, BAL (10) Andrelton Simmons, ATL (28)
3B Josh Donaldson, OAK (20) Nolan Arenado, COL (16)
LF Alex Gordon, KC (27) Christian Yelich, MIA (13)
CF Leonys Martin, TEX (15) Juan Lagares, NYM (28)
RF Kole Calhoun, LAA (2) Jason Heyward, ATL (32)
P

Dustin Pedroia had one of the highest UZR/150 ratings in the league … but he was not the top-rated 2nd baseman in the AL.   We have our third different AL center fielder in three lists.  Otherwise this is a pretty good list.

Next: FRAA: Fielding Runs Above Average, a Baseball Prospectus measure that attempts to remove the bias present in zone-based data and also tries to factor in the tendencies of the pitcher on the mound (ground-ball guy, fly-ball guy,

Pos AL FRAA NL FRAA
C
1B Steve Pearce, BAL (7.7) Adrian Gonzalez, LAD (11.4)
2B Jason Kipnis, CLE (9.5) Chase Utley, PHI (6.9)
SS Alexei Ramierez, CWS (8.1) Jean Segura, MIL (23.6)
3B Kyle Seager, SEA (20.5) Nolan Arenado, COL (14.3)
LF Alex Gordon, KC (12.2) Khris Davis, MIL (6.6)
CF Jacoby Ellsbury, NYY (12.0) Ender Inciarte, ARI (11.0)
RF Kevin Kiermaier, TB (8.3) Jason Heyward, ATL (26.4)
P Dallas Keuchel, HOU (6.7) Tyson Ross, SD (3.7)

Interestingly, Jean Segura shines highly here (the supposed “best defensive player in the league” Andrelton Simmons only scored a 10.0 in FRAA).   And this stat really favors the play of some random players: I had no idea who Kevin Kiermaier or Ender Inciarte were before doing this post, nor did I know what position they played.

Adam Jones scored a -8.1 FRAA; ranking him 1187th out of 1212 players for 2014.  I’m not kidding.  That’s how bad a selection for the Gold Glove Jones was.

Last stat: Baseball Reference’s Total Zone Fielding

Pos AL Total Zone Total Fielding NL Total Zone Total Fielding
C Salvator Perez, CLE (12) Wilson Ramos, WAS (8)
1B Steve Pearce, BAL (13) Justin Morneau, COL (11)
2B Jonathan Schoop, BAL (16) Anthony Rendon, WAS (12)
SS J.J. Hardy, BAL (14) Jordy Mercer, PIT (21)
3B Kyle Seager, SEA (23) Chase Headley, SD/NYY (18)
LF Alex Gordon, KC (25) Khris Davis, MIL (13)
CF Lorenzo Cain, KC (18) Billy Hamilton, CIN (14)
RF Kevin Kiermaier, TB (12) Jason Heyward, ATL (30)
P

Check it out: our own Wilson Ramos is on this list as the “leader” for the NL.  Which, no offense to Ramos, makes you question at least the catcher rankings for this stat.  Rendon also factors in for his partial season at 2B.  But overall, this seems like the least reliable defensive stat.

As mentioned above, both our GG finalists (LaRoche and Span) seem to have been nominated on reputation only; neither of them appeared near the top on any of these statistical measures (unlike last year, when Span at least was a leader in Total Zone)

Did I miss any good defensive metrics?  Do you have one you like more or less than these?  I know there’s other stats out there; I can update this analysis with more of them.


So, how did the Gold Gloves do this year in selecting the most deserving winners?  Pretty good.  Alex Gordon was the AL leader for left fielders in every stat.  I think they picked the two correct short stops.  Catchers are difficult to measure.  They absolutely screwed up the AL Center fielder (though to be fair; there were four statistical measures presented and four different AL center field leaders.  Excellent defensive players who jump around (Lorenzo Cain, Ben Zobrist) make the awards somewhat challenging in some cases.