I don’t think this post is necessarily a surprise to those of us who follow the sport. MLB has a serious competitiveness problem, and it seems to be coming to a particular head for the 2021 season … just in time for the CBA to expire.
The reason I bring this up is because of a series of really, really concerning moves we’ve seen this past off-season, coupled with some of the more seismic moves seen in the past couple of off-seasons, has really got me shocked.
Specifically, i’m about:
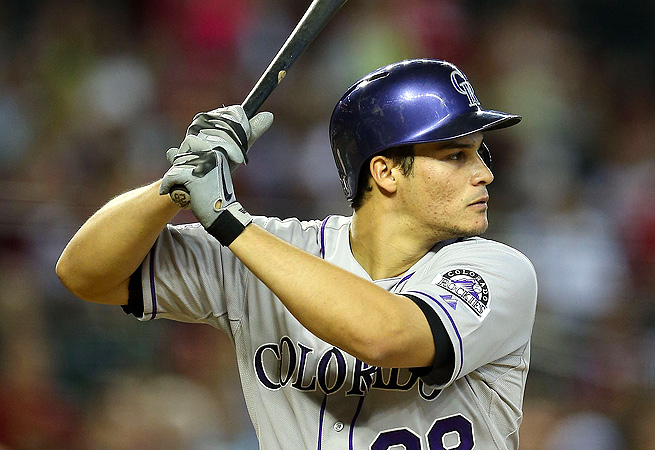
- the Colorado Rockies dumping their franchise player and likely future hall of famer Nolan Arenado for a set of middling prospects AND sending $50M to the Cardinals.
- I’m talking about one of the absolute wealthiest teams in the sport (the Chicago Cubs) trading away key players (Yu Darvish) and doing little to augment their team for 2021.
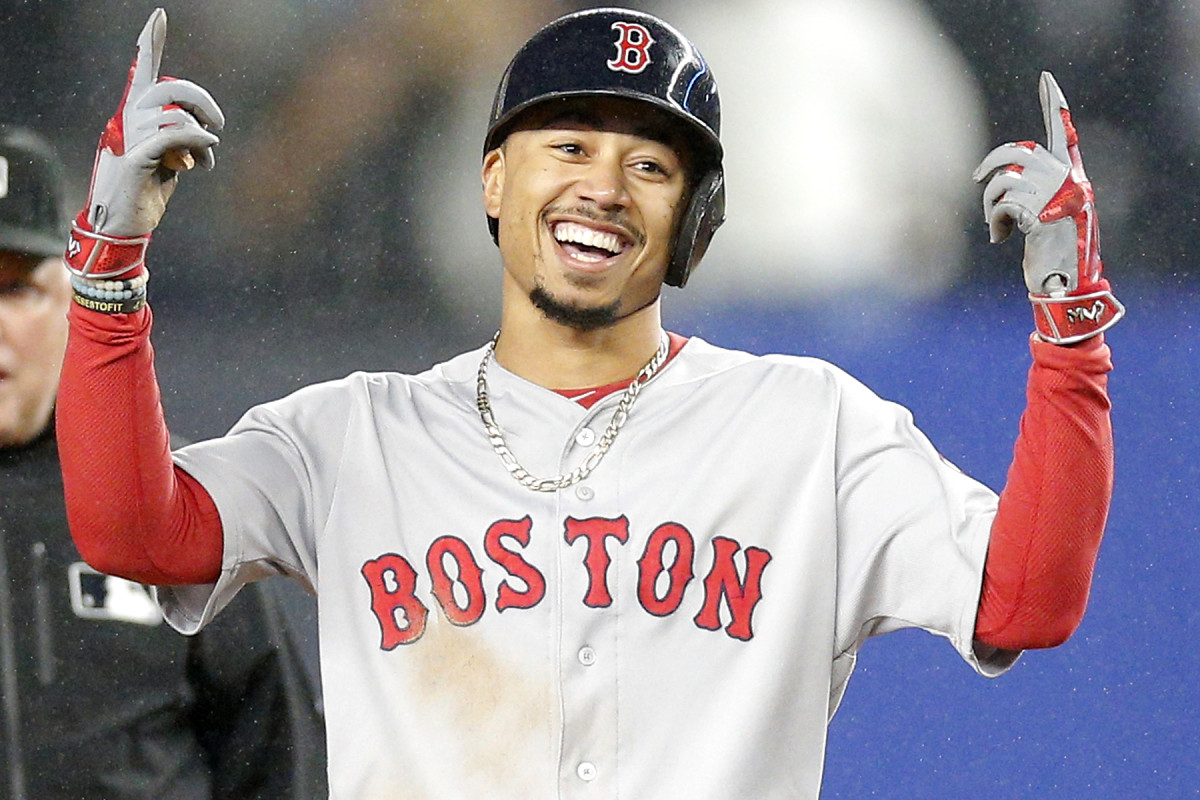
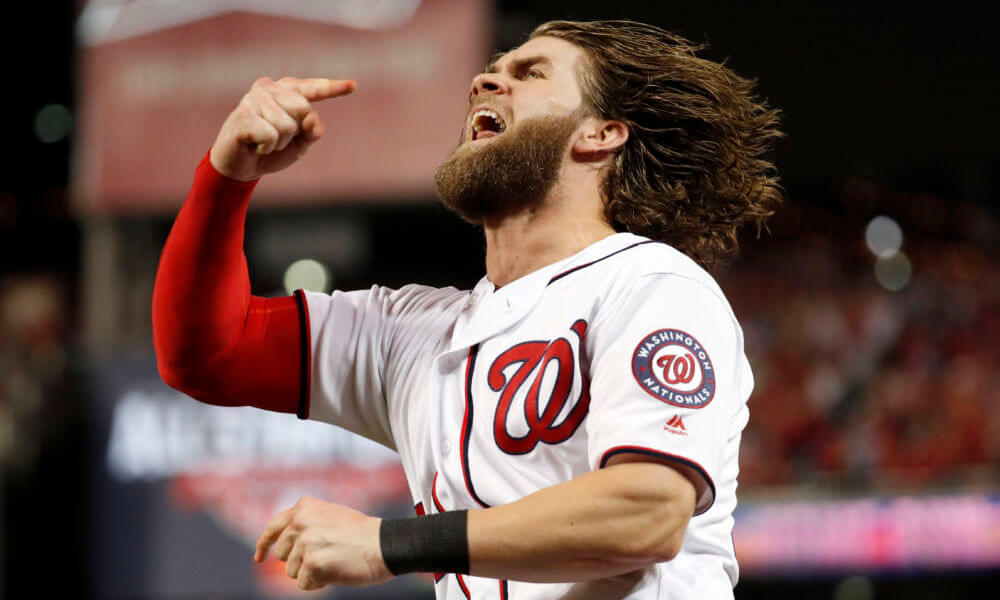
- I’m talking about Boston trading away the best home-grown player they’ve had since, I dunno, Ted Williams, in what amounted to a salary dump (again, this is Boston, who make more than $500M annually in revenues) when they jettisoned Mookie Betts.
- I’m talking about teams in major, huge markets (Texas Rangers, Seattle Mariners) basically not trying.
- I’m talking about the best team in the AL last year (Tampa Bay) flipping its best player (Ian Snell) for 60 cents on the dollar BEFORE he even got that expensive.
- I’m talking about teams like Atlanta (whose numbers are public record because they are owned by a publicly-traded company) earning $476M in revenue in 2019 and basically holding pat on payroll for years.
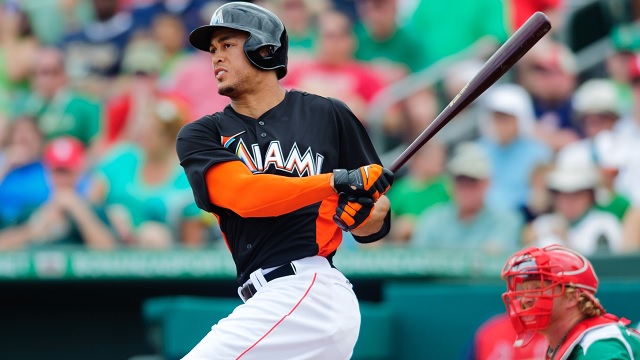
- I’m talking about teams in mid-sized markets (Arizona, Baltimore, Miami) acting as if they’re barely staying afloat.
And so on.
I did a quick analysis of where the MLB teams stand in terms of whether they’re really “trying” for the 2021 season, based on their off-season activity and their 2020 results, and i came up with a pretty shocking list of teams. By my counts:
- 14 teams are purposely doing as little as possible to improve their teams this off-season. Not surprisingly, these 14 teams account for 14 of the 17 smallest projected payrolls right now.
- Another 3 teams are competitive and/or have high payrolls, but are making moves that question their intent (specifically: Boston, San Francisco, and Tampa)
- This leaves the remaining 13 teams which are clearly “trying,” actively signing and improving their teams, increasing payroll, etc. Again, not surprisingly, these 13 “trying” teams currently comprise 12 of the top 13 projected 2021 payrolls.
Here’s the core data, stored by division and then projected payroll rank. I used Cot’s 2021 payroll projections , Fangraphs Roster Resource Depth charts/transaction trackers, and MLBtraderumors 2021 FA tracker to gauge activity.
| Team | Division | Rank | CB Tax 40-man | Trying? | Notes |
|---|---|---|---|---|---|
| Chicago White Sox | AL Central | 11 | 166.6 | Yes | Acquired Lynn, signed Hendricks |
| Minnesota | AL Central | 17 | 125.9 | Yes | Done enough to maintain divisional lead |
| Kansas City | AL Central | 21 | 96.8 | No | Only minor moves |
| Detroit | AL Central | 22 | 91.2 | No | Only minor moves |
| Cleveland | AL Central | 29 | 62.7 | No | Traded Carrasco and Lindor |
| Boston | AL East | 2 | 201.9 | Sort-of | They've made moves, but really payroll hamstrung. Betts trade was disappointing |
| New York Yankees | AL East | 3 | 199.9 | Yes | Signed LeMahiue, Kluber, acquired Taillon |
| Toronto | AL East | 12 | 148.3 | Yes | Springer acquisition plus Siemen trade, Matz trade |
| Baltimore | AL East | 26 | 79.9 | No | Waiver claims and rule5 picks. |
| Tampa Bay | AL East | 28 | 70.1 | Sort-of | … but traded away Snell. |
| Houston | AL West | 4 | 195.8 | Yes | Stable, competitive roster |
| Los Angeles Angels | AL West | 7 | 185.2 | Yes | Acquired Cobb, Iglesias, etc. |
| Texas | AL West | 23 | 89.9 | No | Not really attempting to compete in AL West, traded away Lynn |
| Oakland | AL West | 24 | 89.1 | No | 0 FA signings, almost no off-season activity |
| Seattle | AL West | 25 | 80.6 | No | Very little improvement attempts |
| St. Louis | NL Central | 10 | 169.7 | Yes | Acquired Arenado but that's about it for activity |
| Chicago Cubs | NL Central | 14 | 143.5 | No | Tanking mode; traded Darvish, non-tendered Schwarber |
| Cincinnati | NL Central | 18 | 125.6 | No | Little movement in improving the team. |
| Milwaukee | NL Central | 20 | 102.9 | No | Almost no off-season activity |
| Pittsburgh | NL Central | 30 | 58.2 | No | 100% tanking mode; traded away most of their assets; just ONE guy on a multi-year contract |
| Washington | NL East | 5 | 193.7 | Yes | Multiple acquisitions pre season |
| Philadelphia | NL East | 6 | 186.2 | Yes | Resigned Realmuto big, got Didi |
| New York Mets | NL East | 8 | 180.7 | Yes | Huge moves pre 2021; new owner, signed McCann, acquired Lindor and Carrasco, bullpen signings |
| Atlanta | NL East | 15 | 138.1 | Yes | Two starters … but refuse to go much higher than current |
| Miami | NL East | 27 | 73.6 | No | |
| Los Angeles Dodgers | NL West | 1 | 204.4 | Yes | Defending WS champs |
| San Diego | NL West | 9 | 172.2 | Yes | Got Darvish AND Snell, plus Musgrove?? |
| San Francisco | NL West | 13 | 146.1 | Sort-of | Lots of movement, but none to really make them competitive |
| Colorado | NL West | 16 | 128.3 | No | |
| Arizona | NL West | 19 | 103 | No | Not a SINGLE off-season move |
Furthermore, there’s some teams who I give credit for “trying” who just happen to be in divisions where basically everyone else is NOT trying … so just treading water constitutes as a pathway to success. Going division by division:
- AL East: NY and Toronto competing. Boston sits at #2 in payroll thanks to god-awful contract management during the Dave Dombrowski era. Tampa was the best team in the AL in 2020, but projects to have the 3rd lowest payroll and just flipped Snell. Baltimore of course is doing almost nothing as normal.
- AL Central: Chicago and Minnesota sit mid-league in payroll but get a free ride thanks to the rest of the division actively tanking. Kansas City, Detroit and Cleveland all trying to get worse on purpose.
- AL West: Houston treading water with a great and expensive roster, the result of years of purposely tanking and starting this whole trend. The Angels continue to ineptly spend their money and not get Mike Trout to the playoffs. Nobody else trying, and Texas, Seattle, Oakland all sit in huge markets. Texas in particular is particularly galling; they reside in the 4th largest market in the majors and project to have the 23rd ranked payroll.
- NL East: the most competitive division, with 4 of the 5 teams trying and spending money. Of course, as noted above Atlanta’s wealth is hamstrung artificially (which must be awesome for their fans). Miami continues to be an embarassment, a revenue suck on the rest of the league.
- NL Central: perhaps the most egregious example; just one team seems to be trying to win in 2021 (St. Louis). The other four are dumping players and not spending money (Cubs, Cincy, Milwaukee and Pittsburgh, which projects to the lowest payroll in teh majors)
- NL West: the Dodgers will always spend, and the Padres are really well positioned out of the blue, which has made the rest of the division wave the white flag already. San Francisco treads water getting out from under a ton of expensive, aging players, while Colorado has traded away an all-star team worth of talent in the past few years, and Arizona continues to be one of the most inept franchises in the game while sitting in the 10th largest US market, one that is growing wildly.
For me, a big part of this is the Luxury tax cap, which clearly is treated as a hard cap and thus stops wealthier teams from going over it. But another huge part is the lack of a corresponding salary floor. There’s also little incentive for teams to compete and win with pre-determined RSN payments driving their revenues. I think the league needs to look at bigger revenue sharing for its smaller teams to keep them competitive (like what the NFL does). Lastly, too many teams have now seen the pathway to success that bottoming out does and are emulating it … all at once. Only one team can draft #1 overall, but half the league is trying to do so. How do you resolve this?
In any case … the lack of trying and lack of spending has led to hundreds of millions of dollars of payroll NOT being spent on players … and they’ve got to get the playing field back to level. I think we’re going to see a pretty ugly work stoppage after 2021. I’m sure we’ll be revisiting this. But when it comes to good faith attempts to compete, more than half the league is not holding up their end of the bargain for 2021.