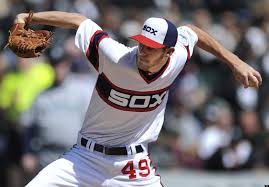
Chris Sale singlehandedly doing his best to disprove the Verducci effect. Photo via landmarknews.com
I’m a number of weeks behind on this post, but I always enjoy the Tom Verducci article published in January of each year discussing what he titles the “Year After Effect” (here’s the link to the 2014 iteration). In it, Verducci identifies a handful of pitchers who, using a simple innings pitched increase year-over-year rule-of-thumb and some added professional analysis, he believes are at risk for regression or injury.
Some links before we get started:
- Here’s my blog post on this topic from last year, which includes a number of links that criticize or dispute the so-called “Verducci effect.”
- Here’s Verducci’s 2013 iteration of his article.
- Here’s Verducci’s 2014 iteration, published on 1/21/14 at cnnsi.com
First, some numbers. Prior to 2013, of the 69 pitchers he’s identified in the last seven years as being at risk, 55 of them suffered an injury/posted significantly worse ERAs. That’s about an 80% prediction clip. Lots of critics of the effect have pointed out that there’s no effect when studying the larger population of pitchers, but that doesn’t explain Verducci’s 80% prediction rate. So I don’t entirely accept that Verducci’s opinion is useless here.
Lets look at 2013’s pitchers and decide whether or not we think they regressed. Verducci named 11 pitchers he thought were in jeopardy of injury and/or regression thanks to a significant workload increase from 2011 to 2012.
| 2013 Candidate Name/team | 2012 IP | 2012 FIP | 2012 xFIP | 2012 SIERA | 2013 IP | 2013 IP Delta | 2013 FIP | 2013 xFIP | 2013 SIERA | Arm Injury? | Verdict |
| Chris Sale, White Sox | 192 | 3.27 | 3.24 | 3.25 | 214 1/3 | 22 1/3 | 3.17 | 2.95 | 2.96 | No | Improve |
| Jarrod Parker, A’s | 214 2/3 | 3.43 | 3.95 | 4.15 | 197 | -17 2/3 | 4.4 | 4.41 | 4.48 | No | Regress |
| Jose Quintana, White Sox | 185 | 4.23 | 4.33 | 4.5 | 200 | 15 | 3.82 | 3.86 | 3.92 | No | Improve |
| Joe Kelly, Cardinals | 187 | 4 | 4.03 | 4.12 | 124 | -63 | 4.01 | 4.19 | 4.31 | No | Regress slightly |
| Stephen Strasburg, Nationals | 159 1/3 | 2.82 | 2.81 | 2.81 | 183 | 23 2/3 | 3.21 | 3.15 | 3.17 | No | Regress slightly |
| Chris Rusin, Cubs | 173 | 4.85 | 4.53 | 4.47 | 187.3 | 14 1/3 | 4.75 | 4.46 | 4.78 | No | Improve |
| Matt Harvey, Mets | 169 1/3 | 3.3 | 3.49 | 3.42 | 178.3 | 9 | 2 | 2.63 | 2.71 | Yes | Injured (TJ) |
| Alex Cobb, Rays | 177 2/3 | 3.67 | 3.54 | 3.51 | 143.3 | -34 3/8 | 3.36 | 3.02 | 3.26 | No | Improve |
| Felix Doubront, Red Sox | 161 | 4.37 | 3.81 | 3.84 | 162.3 | 1 1/3 | 3.78 | 4.14 | 4.26 | No | Improve |
| Dan Straily, A’s | 191 1/3 | 6.48 | 5.3 | 4.72 | 184 | -7 1/3 | 4.05 | 4.22 | 4.26 | No | Improve |
| Andrew Werner, Padres | 166 2/3 | 4.09 | 3.93 | 3.85 | 165 | -1 2/3 | 4.28 | ? | ? | No | Regress |
Interesting; of the 11 pitchers Verducci mentioned last year, only one suffered any kind of arm injury, and that was Matt Harvey (who was well on his way to the NL Cy Young, posting incredible numbers for a guy with his sustained velocity). A couple of these guys saw significantly fewer innings in 2013 thanks to being either relegated to the bullpen (Joe Kelly) or having suffered a non-arm injury (Alex Cobb, who suffered a concussion and missed 10 starts). Meanwhile, only two of the eleven guys “really” regressed in 2013 (Jarrod Parker and Andrew Werner, who spent the whole year in AAA hence the question marks for some of the advanced stats,which are not kept for minor leaguers on fangraphs). Six of the eleven guys distinctly improved their overall stats, including specifically Chris Sale, who had a *massive* innings increase from 2011 to 2012, threw more innings yet again in 2013 and posted better numbers despite having what is easily described as “unorthodox” mechanics.
Our own candidate Stephen Strasburg “regressed slightly” from 2012 to 2013, posting mostly 4/10ths of a point regressions in his major pitching statistical component. He missed a couple starts here and there due to a shoulder strain and forearm tightness, but otherwise threw 183 innings, increased his workload by 23 2/3 innings, and made 30 starts. For those that expect Clayton Kershaw-greatness out of Strasburg, 2013 was a disappointment, but in the larger picture his numbers still were generally top-10 across the board. Its tough to claim he regressed when he’s “just” a top-10 pitcher in the league … but that’s the price of fame I suppose.
Conclusions: before 2013 Verducci was 55 for 69 in successful year-after effect predictions of regression/injury. I’m saying he went just 5 for 11 with his 2013 predictions, so now he stands at 60-for-80 lifetime, still a 75% prediction rate. Verducci does note that of the 11 candidates from last year, only four were “really” candidates (Kelly, Quintana, Parker and Sale), and the rest just barely broke his 30 innings threshold.
Who did he pick for 2014’s watch list? Unfortunately for Nats fans, another of our own is present; Taylor Jordan. Jordan pitched nearly 48 more innings in 2013 than he ever had professionally before, which triggers his presence on this list. We all know the reason why; he never really threw a full season in 2009 or 2010, had Tommy John surgery in mid 2011, came back to throw just 15 starts in 2012, and 2013 was his first full season back. The team had an innings cap for him (just as they had one for Jordan Zimmermann and Strasburg), and when Jordan got up around the 140 innings mark he was shutdown for the year. Even given that cap, he still threw a ton more innings than he’s ever thrown before and I wouldn’t be surprised to see the team cap his innings at around the 170 mark in 2014.
Here’s a statistical look at Verducci’s 2014 candidates:
| Pitcher, Team | Age as of Jan 2014 | 2013 IP | 2013 IP delta | 2013 ERA | 2013 FIP | 2013 xFIP | 2013 SIERA | |
| Gerrit Cole, Pirates | 22 | 196 1/3 | 64 1/3 | 3.22 | 2.91 | 3.14 | 3.41 | |
| Erik Johnson, White Sox | 23 | 169 2/3 | +62 2/3* | 3.25 | 5.4 | 4.73 | 4.76 | |
| James Paxton, Mariners | 24 | 169 2/3 | 50 2/3 | 1.5 | 3.26 | 3.08 | 3.24 | (only 4 mlb starts) |
| Taylor Jordan, Nationals | 24 | 142 | 47 2/3 | 3.66 | 3.49 | 3.8 | 3.86 | (only 9 mlb starts) |
| Michael Wacha, Cardinals | 21 | 179 2/3 | 45 2/3 | 2.78 | 2.92 | 3.36 | 3.32 | (only 64 mlb innings) |
| Sonny Gray, Athletics | 23 | 195 1/3 | 43 1/3 | 2.67 | 2.7 | 2.92 | 3.11 | (only 64 mlb innings) |
| Danny Salazar, Indians | 23 | 149 | 41 2/3 | 3.12 | 3.16 | 2.75 | 2.79 | (only 52 mlb innings) |
| Andre Rienzo, White Sox | 25 | 169 | 41 | 4.82 | 5.85 | 4.76 | 4.94 | (only 56 mlb innings) |
| Yordano Ventura, Royals | 22 | 150 | 40 2/3 | 3.52 | 5.33 | 4.3 | 4.46 | (only 15 mlb innings) |
| Jose Fernandez, Marlins | 20 | 172 2/3 | 38 2/3 | 2.19 | 2.73 | 3.08 | 3.22 |
A large number of these players were mid 2013 season call-ups, and their 2013 stats are mostly based on short-sample sizes (where noted). We’ll revisit these pitchers next year to see what happened, and to judge whether teams are starting to mind these innings increases a bit more closely. What interests me with this list (besides Jordan’s presence on it) is the number of high-profile arms listed here. Salazar, Fernandez, Cole, and Wacha all are expected to be significant contributors in 2014; will the run into arm issues?
What do you guys think about Verducci’s annual study? Bunk? Pseudo-science?