Nationals Arm Race

"… the reason you win or lose is darn near always the same – pitching.” — Earl Weaver

Archive for the ‘catfish hunter’ tag

Jack Morris, Statistics and the meaning of the Hall of Fame

10 comments

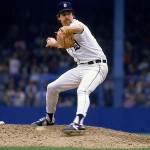
Its Hall of Fame ballot time. Let the Jack Morris arguments start-up again. Photo John Iacono via si.com

(coincidentally, this is the exact same picture and exact same caption as I used last year.  Nothing w/r/t Morris has changed).

Every year about this time comes the inevitable Jack Morris battles when it comes to deciding whether or not he’s a Hall-of-Famer.  Those who argue against him (and argue they do, rather loudly, as exemplified by writers such as David Schoenfield, Rob Neyer, and Joe Posnanski and easily found at nearly any baseball blog, almost all of which are extremely anti-Morris) typically point at Morris’ career ERA, his ERA+, his career WAR and then argue that he was actually a mediocre pitcher.  They have all sorts of arguments against “pitching to score” and even make arguments that middling starters from the 90s are actually “better” than Morris.

My one overriding opinion on the whole “Hall of Fame” worthiness argument is that the stat-inclined seem to be missing the whole point of the “Hall of Fame.”  It isn’t defined as the “Hall of the Best  Statistically Significant players above some arbitrary benchmark.”  If it were, then arguments comparing Morris to Rick Reushel or Brad Radke (both of whom have higher career WARs than Morris) would be important.  (side note: Ironically, this is the same distinction that these people generally also miss when talking about the “Most Valuable Player” award; it isn’t the “Best Player” its the “Most Valuable,” and therefore you can’t just give me a gazillion stats that tell me why Mike Trout had a better season than Miguel Cabrera and call me an idiot for saying that Cabrera was the MVP this year.  How can you be the MVP of a 3rd place team that would have still been a 3rd place team with or without you?  How can you be the “most valuable” player in the league but have zero impact on your team’s standings or the playoffs?  But I digress).

No; its the Hall of FAME (emphasis mine).  It should be the Hall of the most FAMOUS people in the game’s history.  And inarguably Jack Morris is more famous than either Reushel or Radke (since these two pitchers are often used in comparison).  And since its baseball writers themselves that a) remember Morris as being better and more famous than he was according to specific career-measuring stats like WAR, and b) do the voting themselves, its likely that Morris may very well get into Cooperstown despite other people feeling that he’s a lesser pitcher.  Its why a pitcher like Catfish Hunter has been elected already, despite his having even worse career numbers (in the sabre-slanted statistical categories that the new-wave know-it-all bloggers constantly refer to) than Morris.  I can’t recall ever reading one single article talking about how bad it is that Hunter is in the hall of fame, but it seems that EVERY single baseball blogger and columnist out there under the age of 30 has written multiple times about how its the death of the legitimacy of the Hall of Fame if Morris makes it in.  I just don’t get it.

A lot of these arguments seem to be driven by one stat: Career WAR.  People look at that one overriding stat and make their arguments.  My biggest problem with career WAR is its “accumulator nature.”  It rewards a healthy, mediocre pitcher who makes a ton of starts and accumulates a ton of strikeouts and wins and innings pitched. Meanwhile a better pitcher with a higher peak who ends his career earlier won’t “score” as high in career WAR.

The two pitchers in particular i’m looking at in the above paragraph are Bert Blyleven (career bWAR of 89.3) and Pedro Martinez (career bWAR of 80.5).  There is not one person in their right mind that would say with a straight face that Blyleven was a “better” pitcher than Martinez.  But, if you look at the WAR without context you’d argue that was the case.

Blyleven during his career, for those of us actually old enough to have seen him play, was a mediocre pitcher.  Plain and simple.  In 22 seasons he made 3 All Star teams and received Cy Young votes only 4 times, never coming close to sniffing the award.  Morris on the other hand, received Cy Young votes in 7 of his 18 seasons and started the All Star game 3 times.  Morris STARTED more all-star games than Blyleven ever made.  Blyleven was traded for relative nobodies a number of times in his career, and the prevailing press of the day referred to him as a middling pitcher.  Only after he’s retired, when we “discovered” statistics like ERA+ and FIP and realized he was better than his numbers at the time indicated did we make the push for him into the HoF.

Why do I point out All Star appearances and Cy Young voting?  Because in the context of the Hall of Fame discussion, they’re important.  You can quibble about the meaning of all star appearances (certainly they’ve been diluted in the last 20 years) and cy young votes all you want, but the fact is this: if you REALLY want to know who the writers felt were the best players of their day, then all star appearances and Cy Young/MVP voting is vitally important.

But here’s my main point: why can’t the Hall recognize BOTH the likes of Blyleven (better than people realized at the time) AND also recognize Morris (overrated statistically but still historically significant and thus “famous” enough for enshrinement)?  Why do people devote so much time towards disparaging the case for Morris?  Yes, Morris gets undue credit for his fantastic 1991 World Series Start, for leading the 1984 Tigers, for leading the 1980s in Wins.   If you ask any player or manager in the game at the time, they’d likely tell you Morris was one of the best.   But these are all the same aspects that make him “Famous” and thus a likely candidate for the Hall of FAME.  These are the same reasons why a fine pitcher like Curt Schilling, who also was part of some iconic moments in the game’s history, also should be in Cooperstown (in my opinion).

I just feel like the nature of sports writing has come to the point where people use statistical measures as the be-all, end-all proof of everything in baseball.  And then they forget that the game is played by humans, that there are ALWAYS some things that cannot be measured, and just because some statistic has been cheapened in today’s game (I’m thinking of the pitcher Win) does not mean it was always cheapened.  I know there’s people out there who wrote doctoral thesises about how Morris never “pitched to score.”  But how do you measure a pitcher who knows he’s gotta go 9 innings, who knows he’s not getting pulled in the 6th inning for a lefty-on-lefty matchup, who knows he’s more likely to throw 160 pitches than 95?  I absolutely think there’s something in the “pitching to score” arguments, if only because I have played with pitchers who absolutely would coast through games when they got a lead, or who would “take innings off” against in order to preserve their arm to go 9 full innings.  Unless you had a biometric measure on every single pitch Jack Morris ever threw, correlated to the weather, the score, his team’s bullpen status and his manager’s whims, you can NOT tell me that Morris did or did not pitch to score, let up with a big lead, or cruise through innings knowing he may have to go 9 on a 100 degree day.  Just because you can’t prove something mathematically doesn’t mean it still doesn’t exist.  Tom Verducci did an excellent piece recently on Morris and his innings pitched and complete games in context, somewhat related to this topic.

Morris comes from a transitionary time in baseball, before specialized relief pitchers, before the power of the 90s and before PEDs.  He comes from a time severely under-represented in the Hall (think of players like Dale Murphy, Alan Trammell, Denny MartinezOrel Hershiser and Bret Saberhagen: these were the stars of the 80s and some of them barely got 2% of the HoF vote), a side-effect of the ridiculously talented players we saw in the 90s and thus victims of the inevitable comparisons, falling wanting.  He holds an important place in the history of the game, in the narrative of the 1980s, and of the fantastic 1991 World Series.  Cooperstown is a museum, not a spreadsheet.

Call me ignorant, call me old school.  Whatever.  Maybe I’m just tired of the negative rhetoric.  I say “Elect Jack Morris.”
Incentives, Salary and Steroid use in Baseball

3 comments

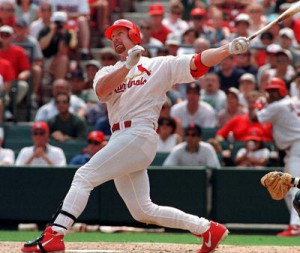
Hit home runs, make lots of money. Repeat. Photo unknown via deadspin.com

A viewing of the HBO special “Freakonomics,” which turns chapters of the popular book into little mini vignettes, along with a conversation with my father prompted me to investigate the aspects of human behavior with regard to incentives when considering the rise of Steroid use by major league baseball players in the late 1990s.  One of the overriding themes in Freakonomics is that any aspect of human behavior can be predicted by analyzing the incentives facing those persons when making a choice.

So the question here is, were the growing incentives to players in terms of rising baseball salaries directly tied to the growing use of Steroids in the mid 1990s?

Steroids had been around for many years prior to appearing en-masse in Baseball.  The most infamous use came from the East German Olympic teams during the late 70s and early 80s, who systematically doped their own athletes (mostly without the athlete’s knowledge) from 1971 until 1990.  But seemingly only after the 1988 Seoul Olympics saw sprinter Ben Johnson test positive for one steroid and admitted the use of a host of other Steroids, Testosterone and HGH substances did the “Steroid Era” in baseball start.  In fact, 1988 is also acknowledged as the beginning of the era in the Mitchell Report (per Section D of the Summary, pg SR-14).  However, I’d argue that the mainstream usage of Steroids didn’t occur for a few years after (see the rise of 45+ homer seasons below).

Here’s a chart of Mean and Median US household income from 1974-2010, with the Minimum and Maximum MLB salaries, the Average MLB salary, that MLB salary listed as a multiple of the US mean income, and the number of 45+ home run seasons seen per year:

Year Median Income: Current Dollars Mean Income: current dollars Minimum MLB Salary Maximum MLB Salary Average MLB Salary Avg MLB salary as multiple of Mean US income # of 45+ Homer Seasons
2012 $480,000 $32,000,000
2011 $414,000 $32,000,000 $3,305,393 0
2010 $49,445 $67,530 $400,000 $33,000,000 $3,297,828 49 1
2009 $49,777 $67,976 $400,000 $33,000,000 $3,240,206 48 3
2008 $50,303 $68,424 $390,000 $28,000,000 $3,154,845 46 1
2007 $50,233 $67,609 $380,000 $23,428,571 $2,944,556 44 4
2006 $48,201 $66,570 $327,000 $21,680,727 $2,866,000 43 5
2005 $46,326 $63,344 $316,000 $26,000,000 $2,632,655 42 5
2004 $44,334 $60,466 $300,000 $22,500,000 $2,486,000 41 4
2003 $43,318 $59,067 $300,000 $22,000,000 $2,555,000 43 4
2002 $42,409 $57,852 $300,000 $22,000,000 $2,383,000 41 4
2001 $42,228 $58,208 $300,000 $22,000,000 $2,264,000 39 9
2000 $41,990 $57,135 $200,000 $15,714,286 $1,987,000 35 4
1999 $40,696 $54,737 $200,000 $11,494,794 $1,726,000 32 6
1998 $38,885 $51,855 $200,000 $14,936,667 $1,378,000 27 9
1997 $37,005 $49,692 $200,000 $10,000,000 $1,314,000 26 3
1996 $35,492 $47,123 $200,000 $9,237,500 $1,101,000 23 6
1995 $34,076 $44,938 $109,000 $9,237,500 $1,094,000 24 1
1994 $32,264 $43,133 $100,000 $6,300,000 $1,154,000 27 0
1993 $31,241 $41,428 $100,000 $6,200,000 $1,062,000 26 3
1992 $30,636 $38,840 $100,000 $6,100,000 $1,012,000 26 0
1991 $30,126 $37,922 $100,000 $3,800,000 $845,383 22 0
1990 $29,943 $37,403 $100,000 $3,200,000 $589,483 16 1
1989 $28,906 $36,520 $60,000 $2,766,667 $489,539 13 1
1988 $27,225 $34,017 $60,000 $2,340,000 $430,688 13 0
1987 $26,061 $32,410 $60,000 $2,127,333 $402,579 12 3
1986 $24,897 $30,759 $60,000 $2,800,000 $410,517 13 0
1985 $23,618 $29,066 $60,000 $2,130,300 $368,998 13 0
1984 $22,415 $27,464 $30,000 $2,500,000 $325,900 12 0
1983 $20,885 $25,401 $30,000 $2,500,000 $289,000 11 0
1982 $20,171 $24,309 $30,000 $2,500,000 $245,000 10 0
1981 $19,074 $22,787 $30,000 $2,500,000 $195,500 9 0
1980 $17,710 $21,063 $30,000 $2,500,000 $146,500 7 1
1979 $16,461 $19,554 $16,000 $1,170,000 $121,900 6 3
1978 $15,064 $17,730 $16,000 $700,000 $97,800 6 1
1977 $13,572 $16,100 $16,000 $700,000 $74,000 5 1
1976 $12,686 $14,922 $16,000 $700,000 $52,300 4 0
1975 $11,800 $13,779 $16,000 $670,000 $44,676 3 0
1974 $250,000 $40,839 0

There’s several landmark seasons of note in terms of escalating Salaries through this list.  By year:

  • 1975 saw Catfish Hunter become the first “true” Free Agent subject to bidding wars among teams, and signed a 5yr/$3.35M deal with the Yankees that resulted in his league-leading salary to nearly triple the league leading salary from 1974.
  • 1979 saw Nolan Ryan become the first $1million/year player.
  • In 1982 George Foster became the first $2M/year player.
  • By 1989, Kirby Puckett became baseball’s first $3M/year player.
  • In 1992, Barry Bonds hit free agency on the heels of MVP seasons in Pittsburgh and more than doubled the previous high annual salary.
  • By 1996, salaries were rising quickly; Albert Belle signs a $10M/year contract.
  • 2001 saw Alex Rodriguez‘s infamous Texas contract kick in, paying him $22M/year, nearly $7M more per year than the next closest player (Kevin Brown, who signed baseball’s first 9-figure contract).
  • Rodriguez opted out of that same contract and re-negotiated the terms even higher with the Yankees, eclipsing the $30M/year mark by 2009.

Meanwhile, take note of the red-colored years of 1996 to 2001, the core of the Steroid Era.  1996 saw no less than Six players eclipse the 45 home run barrier, including Brady Anderson in a complete aberration year for the lead-off hitter (he hit 50 homers in 1996 but averaged just 19 per 162 game segment and never hit more than 24).  Suddenly in 1998 no less than Nine players eclipsed the mark, lead by the Mark McGwire/Sammy Sosa home-run hitting competition that transfixed the nation and “saved” baseball.  Too bad we now know what America didn’t know then; that both players were using Performance Enhancing drugs to beef up, help power out baseballs and take advantage of a slew of new ballparks that opened in the era that featured cozier dimensions and more offense.

By 2002, enough pressure from the front office towards the player’s union had taken place to start testing, leading to the infamous “anonymous survey” done of players in 2003 that resulted in “between 5-7%” of players testing positive, leading to mandatory testing in 2004.  By 2008 we were back down to homer levels not seen since the early 1990s, and baseball didn’t see a single player hit the 45 homer barrier in 2011.  But historically the damage has been done; the home run leader boards from the time period in question lists like a Who’s Who of steroid accusations, and a generation of middle-aged baseball writers who grew up idolizing the home run leaders of yesteryear now seems set to penalize these players for their drug usage (proven or otherwise, as with the Jeff Bagwell Hall of Fame case).

But, everything I just wrote is known narrative.  Lets talk about the explosion of baseball salaries as compared to the common man.  In 1975 the average MLB salary of $44k was a little more than 3-times the mean US household income, having risen only gradually over the years thanks to the Reserve clause and a non-existent players union.  It was a boon for owners, who kept salaries down and profits high.  But the low salaries also meant that most baseball players were considered “within reach” of the every-man in America.  Players weren’t paid such ridiculously high salaries that they essentially live in a different world from the fans (as is the case today with most professional athletes in this country): these players were considered “just like us” to a certain extent, and frequently had off-season jobs, working along side the same people who paid a few bucks for a bleacher seat to cheer them on.  “America’s Pastime” largely earned that title from being the only sport in town for most of the century, but was also helped along by the “within reach” argument.

By 1980, with the country in a severe recession and gas lines around the block, Joe Public slightly increased his average pay.  However, Baseball players, thanks to the breaking of the reserve clause and the rise of Free agency were seeing a boom in salary hikes.  By 1980, the average MLB wage was 9 times the median income in the country and a few ballplayers were making $1M/year.   This ratio of US income to MLB income grew slightly over the next decade; ten years on in 1990 the average MLB wage was just 16x the US income.  But changes were about to come.  In 1996 the MLB salary multiple was 23-times the US mean, but by 2001 it was nearly 40-times the US mean salary.  The average MLB salary more than doubled inside of these 5 years.  This change coincided exactly with the beginnings of the Steroid era and also mirror the 6 year stretch where the game saw its historical rise in home runs.

So the question is: is this coincidence?  Was the rise in steroid use driven by player’s desires to maximize their earning potential or was it vice-versa (i.e., players discovered steroids could escalate performance, started using and producing and that lead to the quick rise in payroll?)  Or was this all more attributable to weaker pitching driven by expansion and  smaller ball-parks?

I think you can make the case that home run hitters were highly compensated and were commercially the “heros” of the game (remember the “Chicks Dig the Long Ball” commercials?), and other players figured out that Steroids helped pack on muscle mass and enabled themselves to hit the ball further and faster (to say nothing of the fact that steroids enabled players to come back from injury faster and to stay stronger through the season by virtue of added muscle mass), and rode the trend.  Hit 40-45 home runs one year, sign a contract extension the next.  Suddenly the game found itself full of juiced up, highly compensated sluggers with a massive ethical problem.

What do you think?

Sources used:

Year Median Income: Current Dollars Mean Income: current dollars Minimum MLB Salary Maximum MLB Salary Average MLB Salary Avg MLB salary as multiple of Mean US income # of 45+ Homer Seasons
2012 $480,000 $32,000,000
2011 $414,000 $32,000,000 $3,305,393 0
2010 $49,445 $67,530 $400,000 $33,000,000 $3,297,828 49 1
2009 $49,777 $67,976 $400,000 $33,000,000 $3,240,206 48 3
2008 $50,303 $68,424 $390,000 $28,000,000 $3,154,845 46 1
2007 $50,233 $67,609 $380,000 $23,428,571 $2,944,556 44 4
2006 $48,201 $66,570 $327,000 $21,680,727 $2,866,000 43 5
2005 $46,326 $63,344 $316,000 $2,600,000 $2,632,655 42 5
2004 $44,334 $60,466 $300,000 $22,500,000 $2,486,000 41 4
2003 $43,318 $59,067 $300,000 $22,000,000 $2,555,000 43 4
2002 $42,409 $57,852 $300,000 $22,000,000 $2,383,000 41 4
2001 $42,228 $58,208 $300,000 $22,000,000 $2,264,000 39 9
2000 $41,990 $57,135 $200,000 $15,714,286 $1,987,000 35 4
1999 $40,696 $54,737 $200,000 $11,494,794 $1,726,000 32 6
1998 $38,885 $51,855 $200,000 $14,936,667 $1,378,000 27 9
1997 $37,005 $49,692 $200,000 $10,000,000 $1,314,000 26 3
1996 $35,492 $47,123 $200,000 $9,237,500 $1,101,000 23 6
1995 $34,076 $44,938 $109,000 $9,237,500 $1,094,000 24 1
1994 $32,264 $43,133 $100,000 $6,300,000 $1,154,000 27 0
1993 $31,241 $41,428 $100,000 $6,200,000 $1,062,000 26 3
1992 $30,636 $38,840 $100,000 $6,100,000 $1,012,000 26 0
1991 $30,126 $37,922 $100,000 $3,800,000 $845,383 22 0
1990 $29,943 $37,403 $100,000 $3,200,000 $589,483 16 1
1989 $28,906 $36,520 $60,000 $2,766,667 $489,539 13 1
1988 $27,225 $34,017 $60,000 $2,340,000 $430,688 13 0
1987 $26,061 $32,410 $60,000 $2,127,333 $402,579 12 3
1986 $24,897 $30,759 $60,000 $2,800,000 $410,517 13 0
1985 $23,618 $29,066 $60,000 $2,130,300 $368,998 13 0
1984 $22,415 $27,464 $30,000 $2,500,000 $325,900 12 0
1983 $20,885 $25,401 $30,000 $2,500,000 $289,000 11 0
1982 $20,171 $24,309 $30,000 $2,500,000 $245,000 10 0
1981 $19,074 $22,787 $30,000 $2,500,000 $195,500 9 0
1980 $17,710 $21,063 $30,000 $2,500,000 $146,500 7 1
1979 $16,461 $19,554 $16,000 $1,170,000 $121,900 6 3
1978 $15,064 $17,730 $16,000 $700,000 $97,800 6 1
1977 $13,572 $16,100 $16,000 $700,000 $74,000 5 1
1976 $12,686 $14,922 $16,000 $700,000 $52,300 4 0
1975 $11,800 $13,779 $16,000 $670,000 $44,676 3 0
1974 $250,000 $40,839 0