Nationals Arm Race

"… the reason you win or lose is darn near always the same – pitching.” — Earl Weaver

Archive for the ‘jack morris’ tag

Opening Day Starter Trivia 2021

leave a comment

Kershaw gets another opening day start in 2021. Photo via wiki.

Every year I update this long-running XLS for this increasingly anachronistic relic of tracking Opening Day Starter honors for teams.

After this year’s opening day, which was delayed for nearly a week thanks to the Nats Covid outbreak, here’s some cool trivia:

  • Most Opening Day StartsActive Leaders:
    • Justin Verlander remains the current leader with 12, though he’s out for the season with injury.
    • Clayton Kershaw made his 9th opening day start after missing a couple in a row, making him the pitcher with the highest number that is still actively making opening day starts.
    • Felix Hernandez and Jon Lester have 10 and 8 opening day starts respectively, but neither
    • After these guys, the players with the most are Madison Bumgarner (7), Max Scherzer (6) and Julio Teheran (6).
  • Current Leading Consecutive streak:
    • both Max Scherzer and Aaron Nola are on a consecutive opening day start streak of 4 starts.
  • Number of first-time Opening Day Starters in 2021: Just 7. This is after 18 last year.
  • Number of Opening Day Starters who now have exactly two opening day starts: 14 of the 30.
  • Most surprising opening-day starters in 2021:
    • Chad Kuhl: well someone had to pitch opening day for Pittsburgh, who may lose 115 games this year.

Historically, here’s the all-time record holders:

  • Most Ever Opening day StartsTom Seaver with 16.  Tied for 2nd place with 14 is Jack Morris, Randy Johnson and Steve Carlton
  • Most Consecutive Opening Day StartsJack Morris, all of whom’s 14 opening day starts were in a row.

Hope you enjoy this useless trivia!

Opening Day Starter Trivia 2019

22 comments

Verlander makes his 11th career opening day start, tying him for the active lead. Photo via sporting News.

Verlander makes his 11th career opening day start, tying him for the active lead. Photo via sporting News.

Every year I update this long-running XLS for this increasingly anachronistic relic of tracking Opening Day Starter honors for teams.  But it does make for some good trivia questions.

After this year’s opening day (including the two-day series in Japan), here’s some interesting stats related to Opening Day Starts from around the league:

  • Most Opening Day Starts, Active Leaders:
    • Justin Verlander makes his 11th and he seems well suited to increase that total given current form and new contract.
    • 11 ties him with both CC Sabathia and Felix Hernandez for the most active, neither of whom seem like they’ll get another shot to extend their totals.
    • Next closest are three tied with 8 each: Jon LesterClayton Kershaw and James Shields.  Lester’s is active, Kershaw’s should continue, while Shields remains unsigned for 2019 and seems unlikely to get another shot.
  • Current Leading Consecutive streak:
    • Julio Teheran with 6, which is pretty amazing because there was talk of him not even making the team with all the pitching depth Atlanta has.
    • Next closest is Corey Kluber with 5.
    • Nobody else really is close.  Lester has 3 straight for the Cubs, to add to his total of 8 between Boston and Chicago.
  • Consecutive streaks ended in 2019:
    • Felix Hernandez has his streak of 10 starts broken, and he wasn’t happy about it.
    • Kershaw had his streak of 8 broken thanks to the spring training injury.
    • Chris Archer has his streak of 4 broken thanks to a mid-season 2018 trade.
  • Number of first-time Opening Day Starters in 2019: 14.
    • deGrom, Castillo, Taillon, Mikolas, Freeland, Ryu, Lauer, Snell, Rodon, Keller, Berrios, Fiers, Gonzales, Minor
    • I’d say half of these are rewards for excellent 2018 seasons (deGrom, Taillon, Mikolas, Freelan, Snell for sure, perhaps also Berrios), some are covering for obvious candidates who are injured (Ryu), while the rest mostly play for tanking teams who have little better choice than to name a starter for opening day (Castillo, Lauer, Rodon, Keller, Fiers, Gonzales and Minor).
    • This is the highest number of first-time opening day starters in my decade of tracking this.

Historically, here’s the all-time record holders:

  • Most Ever Opening day Starts: Tom Seaver with 16.  Tied for 2nd place with 14 is Jack Morris, Randy Johnson and Steve Carlton
  • Most Consecutive Opening Day Starts: Jack Morris, all of whom’s 14 opening day starts were in a row.

Hope you enjoy this useless trivia!


Obligatory Post on the 2019 Hall of Fame class

41 comments

Rivera's last Yankee Apperance. Photo Jim McIsaac/Long Island Newsday.

Rivera’s last Yankee Apperance. Photo Jim McIsaac/Long Island Newsday.

Its that time of the year, so that means Hall of Fame Ballot time.  BBWAA Writers should have mailed in their ballots by 12/31/18, and we should start seeing a glut of “this is who I voted for and why” posts come out this week.

Nearly 25% of the voters got a jump on things and published early; as of Christmas more than 90 ballots were in Ryan Thibodaux‘s tracker and as of the new year he’s got more than 130 of the total 412 ballots available.

If you’re still “in” on the hall after the inexplicable Harold Baines election, then read on.

Here’s two key links for you, if you’re still reading:

And, here’s a link to one of the best “imaginary hall of fame” ballot stories i’ve ever read, from Jay Jaffe, he of JAWS fame, breaking down the ballot in a great way.

My consideration of candidates for the Hall, unlike my consideration of a lot of stuff in baseball, comes down more to “feel” than it does to stats.  I know Jay Jaffe  has his great JAWS thing that tries to do both peak and longevity.  I know b-r.com has a bunch of metrics per player.  That’s all great.  But it isn’t the hall of stats, it isn’t the hall of WAR.  Its the Hall of Fame.  Its the hall of marquee players from their day.  I look at the players I’d vote for and … they’re the guys you paid money to see.  They’re the arms that were on the mound and you gave the opposing team little chance.  They’re the sluggers who you wanted up in the 9th inning of a tie game.  That’s what makes the game exciting and that’s the lens I like to use when judging players.  Yeah its subjective and partisan; so is every person voting in the BBWAA.  Even Jaffe admits there’s stats and then there’s consideration in his excellent article linked above.

With my imaginary ballot, here’s how i’d vote.  Since there’s a (ridiculous) limit of 10 players per ballot, I’ll list these players in rough order of voting priority to start:

New to the 2019 Ballot Candidates:

  • Absolute Yes on Mariano RiveraRoy Halladay.
    • Rivera may be the closest we ever get to a unanimous player; a dominant closer who impacted the post-season for two decades and was a great guy with no enemies in the press.
    • Halladay was the best or among the best pitchers in baseball for nearly a decade, winning Cy Youngs in both leagues and throwing a post-season no-hitter.  He unfortunately also gets posthumous votes thanks to his ill timed death early in 2018.  Yes, his inclusion technically “lowers” the SP bar .. but I think its just about time people started realizing we have to re-think the way we evaluate SPs in our game.
  • Slight pause to consider Todd Helton, Lance BerkmanAndy Pettitte and Roy Oswalt, but then still vote no.  For each, here’s a couple of thoughts:
    • Helton had a 5 year stretch where he was once of the most feared  hitters in the game, and accumulated a ton of WAR … but was kind of a lack-of-power 1B who got a boost playing in Colorado and probably wasn’t anywhere close to the player that Fred McGriff was, who couldn’t sniff the hall.
    • Berkman was an even better, more dangerous hitter … he retired with a career OPS+ of 144, but aged badly and was done by 37.  His intolerant political views can’t be helping him either (in the same vein they’re affecting Schilling)
    • If you didn’t like Jack Morris, you probably don’t like Pettitte either, as they profile very similarly.  Pettitte has the distinction of having the most Wins in the first decade of the new year … and with Morris’ inclusion every “decade leading” wins getter is in the Hall.  But something tells me that streak ends here.  He also has a bona-fide PED testing result that, for some reason or another, isn’t viewed with nearly the vitriol as other PED-associated players (Bonds, Clemens, McGwire, Sosa, etc).  Amazing how the media narrative changes based on the player (Pettitte == “good guy” while Bonds == “bad guy.”)
    • Oswalt burst onto the scene and was one of the best pitchers in the NL for the first half of his career … then disappeared and was done as an effective pitcher by the age of 33.  He’s like the Orel Hershiser of his generation, but only half as accomplished.
  • No on everyone else, and there’s nobody really close.

Returning Ballot Candidates; i’m not re-litigating these candidates, since i’ve written many times on them in the past.   Plus, most of these guys have been on the ballot so long that, frankly, nobody wants to hear your justification any more.  Its like politics; reading my blog post isn’t going to change your opinion on the Border Wall.

  • Absolute Yes on Roger Clemens, Barry Bonds, Edgar Martinez, Mike Mussina
  • More tepid Yes on Curt Schilling, Manny Ramirez, Fred McGriff
  • Almost ready to say Yes on Gary Sheffield, Billy WagnerScott Rolen
  • Pass for now on Jeff Kent, Larry Walker, Sammy Sosa, Omar Vizquel, Andruw Jones.

So i’ve got absolute Yes’s on 6 guys, tepid Yes on another three, then would probably throw on Sheffield as my 10th.

I vote Yes on Mariano, Halladay, Clemens, Bonds, Edgar, Mussina, Schilling, Manny, McGriff and Sheffield.

I get the arguments for Walker, for Wagner, for Sosa, for Jones.  That’s why lots of people say there’s 14 worth candidates on this year’s ballot but only 10 spots.  Maybe next year.


So if you didn’t like Jack Morris in the Hall … what are you saying about Baines??

32 comments

Baines comes from out of nowhere to get elected to the Hall. Photo via BroBible.

Baines comes from out of nowhere to get elected to the Hall. Photo via BroBible.

Last week, we heard that Lee Smith and Harold Baines were selected by this 16-person “Today’s Game Era Committee” to be in the Hall of Fame.

Honestly, I’m not sure why we pay so much attention to this institution at this point; literally every decision they make seems to be in direct conflict with what the general consensus of the sport’s fandom thinks makes sense.

  • Too many players on the ballot?  By all means, don’t expand the ballot.
  • Too many players on the ballot needing more years to get elected?  Oh, lets shorten the amount of time players can stay on the ballot.  Of course!
  • Tired of seeing illogical votes?  The writers themselves voted to make their votes public … but the Hall of Fame said no.
  • Old-timey players found out to be relatively unworthy due to new knowledge of the game?  Oh, lets ignore years/decades of writer voting and just hand them a spot in the hall.

Lets talk about them one at a time

Smith aged off the ballot after 15 years in 2017, getting 34.2% of the electorate vote his final year, peaking just above 50% in one of his years on the ballot.   He was a journeyman closer (8 teams in 18 years) with a gazillion saves (478) and a 3.00+ ERA with a middling bWAR figure (29.4), 16% of which came in his best season.  We talked about him for years; he was a mediocre to good closer, nothing special, and came into the ballot at a time where there was a huge glut of candidates as well as better/more famous closers in the discussion.   He made 7 all-star teams and had three Cy Young leading seasons back when people thought that saves were actually worthy of voting for (to wit, he finished 2nd in Cy Young voting in 1991 b/c he led the league in saves with 47 saves … and had a 2.3 bWAR season.  Meanwhile, last year Tanner Roark, you know the guy who a lot of Nats fans were convinced we should non-tender due to his crummy performance … he posted a 3.0 bWAR for 2018.  Yeah; even a replacement level starter right now is more valuable than an all-star closer).

That is a hall of famer?

Meanwhile Baines was even more of a journey-man; playing 22 seasons across 5 franchises and hanging around as a lefty DH type with a solid bat but not highlight power.  He accumulated 38.7 bWAR in his long career, his career apex being a 4.3 bWAR season in 1984.  He made 6 all-star teams and never sniffed even a top5 MVP vote.   He hung on the ballot getting just north of the 5% threshold for several years, then was dropped off when the glut of candidates started in 2011.  That’s right; people lost their minds because Jack Morris got in despite his 3.90 ERA and peaking at 61.5% of the HoF vote … yet Baines is now in despite never getting more than 7% (!) in any year and having a career BA of .289.  His best argument for getting into the Hall seems to his high career hit total (2,866), which will now also be the eventual argument for the likes of Omar Vizquel (career hits: 2,877) and Johnny Damon (career hits: 2,769) to also get added by a chummy veterans committee filled with current employees and former managers.

That’s a hall of famer??

.289 will not be the lowest batting average for any Hall of Famer (not like Morris’ 3.90 being the highest ERA).   Not by a long shot; there’s plenty of guys in the .250-.270 range or lower.  But many of those who have these lower averages also have 500 homers, or are 10x gold glove winners.  Or have some other redeeming qualities.  Baines was often not even the best player on his own team, let alone the league.

I mean, good for him.  He gets to make a speech and join a pretty exclusive club.  He’ll also basically serve as a low-end benchmark going forward for comparison purposes.

But most of the rest of the baseball world is pretty troubled by this.  I’ve always thought that a committee would do a better job of electing players to the Hall, in the same vein that the NFL selection committee seems to do a pretty good job.  But clearly not THIS committee, that includes the arrogant and patently-anti-analytical Joe Morgan (whose letter to the electorate literally led some respected writers to quit the process), and the equally arrogant Tony la Russa, who failed so spectacularly in management with Arizona recently and literally used game winning RBI during an on-screen interview to defend the selection of Baines while claiming anyone who argues against Baines are using “weak *ss superficial bullsh*t.”

Wow.

Whatever.  I’m sure we’ll get some good candidates elected and can argue for or against them during the slow period in early January like always.  But the inclusion of Smith and Baines while the likes of Edgar Martinez and Mike Mussina (in particular) is yet another nail in the coffin of believe-ability for the Hall of Fame as an institution.

Written by Todd Boss

December 16th, 2018 at 9:53 am

Opening Day Starter Useless Trivia for 2018

11 comments

Felix Hernandez made his leading 11th opening day start. Photo Keith Allison via flickr/CCL

Felix Hernandez made his leading 11th opening day start.
Photo Keith Allison via flickr/CCL

Every year I capture the Opening Day Starters into an XLS and then capture some useless trivia on it.  This is that post.

Google Doc XLS link: (the data is too big to make an HTML table): https://docs.google.com/spreadsheets/d/1Mv8gLgJOuJHEAf_pXNwPWGCNRL4RnYEyulH6rxMuudA/edit?usp=sharing

Max Scherzer made his 3rd  career opening day start, all in a Nat’s uniform (he never  got an Opening day start while pitching behind Justin Verlander in Detroit).   Stephen Strasburg has himself made four opening day starts, with these two guys covering every Nats opening day start dating to 2011.

The Nats have one other player with Opening day starts on their resume: Jeremy Hellickson made the 2016 and 2017 opening day starts for Philadelphia.  He currently sits in XST building up arm strength so he can take over for A.J. Cole as our fifth starter after he blows up a couple more times.  And its worth noting that former Nat Jordan Zimmermann earned his first ever such start for Detroit this year, shortly before getting hit in the head with a come-backer.

Here’s some useless trivia related to Opening Day Starts:

  • Active Leader: Tie at the top: Seattle’s Felix Hernandez with 11.  CC Sabathia also has 11, but hasn’t made the Yankee’s start since 2014.
  • Active Consecutive Leader: Also Hernandez, who has made 10 straight, missing one in 2008 when Erik Bedard took the mound in Game 1 as the new shiny FA signing that spring.  The next closest is Clayton Kershaw, who has made 8 straight for LA.
  • Other longish conseutive starts streak: Atlanta’s Julio Teheran with 5, Corey Kluber with 4, and Chris Archer with 4.
  • Madison BumgarnerMasahiro Tanaka and Dallas Keuchel all had 3-4 start streaks broken thanks to injury or being passed over for a different guy.
  • 13 of the 30 games were started by first time Opening Day starters this year, continuing a trend of new,  younger guys getting these starts.  In fact, I’d say that a couple of the opening day starters you’d be hard pressed to pull out of a lineup: Miami’s Jose Urena, Milwaukee’s Chase Anderson, and SF’s Ty Blach in particular.

All-time records:

  • Most Ever: Tom Seaver (16).  Tied for 2nd place with 14 is Jack Morris, Randy Johnson and Steve Carlton
  • Most Consecutive: Jack Morris (14)

Can Felix get 5 more starts to break Morris’ record?   He’s only signed through 2019 with an option for 2020, so he’d need to get an extension … something that’s more and more rare in today’s Baseball climate.

Thanks to that same trend against aging pitchers, a slew of former leaders of Opening Day starts may be permanently retired out of the game.  Guys like Jered WeaverTim Lincecum, Edison Volquez, Yovanni Gallardo (who was just DFA’d), Ricky NolascoJake Peavy and perhaps a few others, all of whom have at least 4-5 opening day starts to their name are struggling to find work right now or may be done.   Its turning into a young man’s game.

Where would 2017 World Series Games 2 or 5 rank historically?

13 comments

This beat my marriage proposal. Photo via sbnation

This beat my marriage proposal. Photo via sbnation

What a World Series!  I predicted Houston would win in 6 primarily because I thought Kershaw would get the series back to LA by winning Game 5, but Verlander  would shut it down in the 6th game.  Didn’t quite happen that way, with both guys pitching well but not getting the result that night.   In the end, I honestly think the better team won this series, and Houston’s bottoming-out gambit has now paid off with the first title in their existence.

What i’m wondering about now is this: two of these World Series games we just saw were just amazingly good games, featuring massive comebacks, late inning heroics, clutch homers, walk-off hits.

Where, if anywhere, do they rank in the pantheon of “Greatest Games?”

I like to use as a jumping off point the excellent MLB.tv series “MLB’s 20 Greatest Games.”   A link to their web page with videos of each game is here.  The list is here:

  • No. 20: May 17, 1979: Phillies @ Cubs; Phils, Cubs combine for 45 runs.  This is the only regular season game on the list and for good reason; the first inning alone had 13 runs scored.
  • No. 19: Oct. 4, 2003: Giants @ Marlins; Ivan Rodriguez tags out Eric Snow as he tries to bulldoze Pudge at the plate to end the game and send the Marlins to the World Series.
  • No. 18: Oct. 12, 1980: Phillies @ Astros; Phils win battle in 10th to win the NLCS with an epic comeback over Nolan Ryan.
  • No. 17: Oct. 17, 2004: Yankees @ Red Sox; Dave Roberts‘ stolen base and David Ortiz‘s walk-off homer cap the Boston win, an epic part of the Boston comeback from 3-0 down in the 2004 ALCS.
  • No. 16: Oct. 6, 2009: Tigers @ Twins; Twins win a game 163 sudden death playoff game for the AL Central title.
  • No. 15: Oct. 8, 1995: Yankees @ Mariners; Edgar Martinez hits “The Double” to get a walk-off win in the ALDS, capping a 10th inning comeback as a young Ken Griffey Jr absolutely flies around the bases to score from first.
  • No. 14: Oct. 23, 1993: Phillies @ Blue Jays; Joe Carter‘s walk-off WS homer foils a great Philly comeback.
  • No. 13: Oct. 26, 1997: Indians @ Marlins; Edgar Renteria wins it for Fish in a World Series game 7 classic.
  • No. 12: Oct. 31, 2001: D-backs @ Yankees; Tino Martinez ties it with a 2-out, 2-run homer in the bottom of the 9th and Derek Jeter hits first November homer and earns himself the nickname for which he’s continued to be known.
  • No. 11: Oct. 2, 1978: Yankees @ Red Sox; Bucky Dent‘s improbable 3-run homer caps a massive October collapse for Boston and continues the legendary rivalry between the teams.
  • No. 10: Oct. 15, 1988: Athletics @ Dodgers; Injured slugger Kirk Gibson hits a pinch hit walk-off home run off of the dominant Dennis Eckersley for one of the most magical home runs in baseball history.
  • No. 9: Nov. 4, 2001: Yankees @ D-backs; Luis Gonzalez floats a ball over the drawn-in infield against Mariano Rivera to win a classic Game 7.
  • No. 8: Oct. 12, 1986: Red Sox @ Angels; Dave Henderson hits an improbable 3-run homer in the 9th to help Boston come back from 1-out away from elimination to eventually beat the Angels in the 86 ALCS.
  • No. 7: Oct. 14, 2003: Marlins @ Cubs; The infamous Steve Bartman game, which overshadowed an utter collapse by Mark Prior, Alex Gonzalez, the Cubs bullpen AND Kerry Wood the following day to continue the Cubs curse that lasts til today.
  • No. 6: Oct. 16, 2003: Red Sox @ Yankees; Aaron Boone suddenly homers off Tim Wakefield in extra innings to end a classic ALCS game 7 between the bitter rivals.
  • No. 5: Oct. 15, 1986: Mets @ Astros; Mets win in 16 as Jesse Orosco put in the relief performance of a lifetime.
  • No. 4: Oct. 14, 1992: Pirates @ Braves; the injured Sid Bream barely beats Barry Bonds‘ throw to score the series winner and effectively send the Pittsburgh franchise into a 20 year tailspin.
  • No. 3: Oct. 25, 1986: Red Sox @ Mets; Probably the most “infamous” game of all time, especially to Boston fans, as Bill Buckner‘s error follows a series of mishaps by the Red Sox pitching staff to turn a 10th inning 2 run lead into a game 6 loss.
  • No. 2: Oct. 27, 1991: Braves @ Twins; Jack Morris‘  seminal performance; a 1-0 10 inning shutout over the Braves in perhaps the best Game 7 of any World Series ever.
  • No. 1: Oct. 21, 1975: Reds @ Red Sox; the game forever known for Carlton Fisk waving his walk-off homer fair, but which should be known for the unbelievably clutch Bernie Carbo 8th inning homer to tie the game and enable the extra inning fireworks.

That’s a great list.  It technically should have been titled “Greatest 20 games of the last half century” since it skipped the classic 1960 Mazeroski game.

Since this series debuted, we’ve seen several really good post season games that I thought should be considered

  • 2011 Game 6: I thought it was a top 5 game when I saw it live, and i’d put it 4th or so on the above list.
  • 2016 Game 7:  I thought it was perhaps in the 5-10 range, putting it just after the Bartman game at #8 in the above list.
  • 2011 final Game of the season: Yankees@Rays: the Red Sox had blown a 9-game lead as of the beginning of the month, culminating with a blown save in the 9th of the final game of the season to open the door for Tampa.  meanwhile, Tampa was hosting the Yankees … and were down 7-0 in the 7th inning before rallying to tie the game, then win it in the 12th on a solo walk-off by super star Evan Longoria just minutes after hearing that the Red Sox had lost.  See the video to watch it  unfold; its pretty unbelievable.
  • 2007 NL Wild Card tiebreaker: Colorado beats San Diego 9-8 in 13 innings by rallying from 2 runs down to walk-off in a controversial play at the plate.

Well, where do you possibly put the two crazy games we just saw in this series?

  • 2017 Game 2: Houston scores in the 8th and 9th to push the game to Extras, blasts two solo homers in the 10th only to have LA tie the game in the bottom of the 10th.  Eventual MVP Springer blasts another homer in the 11th, and LA counters in the bottom of the 11th but falls short.  7 of the 13 runs scored in the game occurred in the extra innings and the teams set a WS record hitting 8 combined homers.
  • 2017 Game 5: Houston made up deficits of 3 and 4 runs early, LA scored 3 in the 9th to force extras, and Houston walked-off a win in the 10th to win a crazy 13-12 5 hour marathon.   As ESPN’s David Schoenfield said, “you thought game 2 was crazy?  Try game 5.

First off; were these truly “great games?”  One game was 7-6, the other was 13-12.  Both featured a ton of hitting and offense obviously, but not a ton of good pitching necessarily.  LA used NINE pitchers in Game 2, and the teams combined to use 14 pitchers in game 5 with neither starter getting out of the 5th.  Game 5 in particular featured both team’s Aces (Kershaw and Keuchel), both former Cy Young winners who both got blasted, and both team’s best reliever (Jansen and Devenski) got hit hard as well.  Some people think a “great game” includes transcendent performances on both sides of the ball, and both of these games were not the case.

Would you put either game into the above list?  I would.  I’d probably choose Game 2 over Game 5 given its late-inning heroics and slightly better pitching, and I’d probably put it in the 15-20 range in the above list.

What do you guys think?

Opening Day 2017; Fun stats and other useless information

15 comments

OpeningDay2017

Happy Opening day!

Here’s my recurring “Opening Day” trivia/useless information post.  Here was 2016’s version,  2015, 2014 and 2013.  I also reference many Google XLS/Google Doc creations with historical data below, all of which have been updated for 2017.


Nats 2017 Opening day Payroll:

Why are these values different?   Cots and USA today disagree on Strasburg’s 2017 salary to the tune of about $2M, and that’s about the difference between their two figures.   My XLS counts all salaries in *current dollars* only, as opposed to the salary cap figures that USA Today and Cots do (Cots also splits out the signing bonuses prorated to each year of the contract).  Plus I count in payments to former players (in our case, Petit and Norris).  I believe this is a better representation of how the team and the Lerners see their payroll.  Teams that have huge payments to former players (like the Dodgers and Padres) should absolutely have those “dead money” payments included.  Roughly speaking, Strasburg and Scherzer both are getting $15M in current dollars but more than $40M combined in these claculations, which is a huge part of the delta between my XLS and Cots’.

Oh, by the way, the Nats now have $199 MILLION dollars of deferred payments on the books when adding in Blanton’s (mostly) deferred salary.


Opening Day Payroll; MLB wide

See this link for the list of all team payrolls at USA Today.  And Here’s Cot’s/Baseball Prospectus’ compensation home page.

I’ve put both of these lists side by side into this little handy Payroll XLS to demonstrate how ridiculously bad the USA Today figures are.  They’re off by $35M for the Padres and by $53M for the Los Angeles Dodgers.  Thats because the USA Today figures don’t account for any salaries being paid for former players, which in the modern game has more and more become a standard.  So, basically I ignore USA Today’s figures and always use Cot’s.

The Dodgers continue to lead the way (by either measure).  The Brewers are now dead last, just ahead of the purposely tanking Padres.  You may have seen posts that noted that Clayton Kershaw gets paid more this year than the Padres entire 25-man roster, and that’s true, but it ignores the $30M+ of dead money on their payroll.

The Nats are 9th on both lists.  Imagine what we could spend with a market value RSN!!


Home Openers Information

Opening Day 2017 attendance was announced at 42,744 .  That’s up more than a thousand from last year.  Here’s all our home openers in order with attendance, time of game, weather:

  • 2017: 42,744 (1:05 monday game, 66 and cloudy)
  • 2016: 41,650 (4:05 thursday game, 60 and 1.5hr rain delay)
  • 2015: 42,295 (4:05 monday game, 75 and gorgeous)
  • 2014: 42,834 (1:05 friday game, 50s and overcast)
  • 2013: 45,274 (1:05 monday game, 60 and beautiful)
  • 2012: 40,907 (1:05 thursday game 56, partly cloudy)
  • 2011: 39,055 (1:05 thursday game, 41 degrees and overcast)
  • 2010: 41,290 (1pm game monday, beautiful weather 80s and sunny): Phillies invasion
  • 2009: 40,386 (3pm game on a monday, chilly 53degr and overcast)
  • 2008: 39,389 (season and stadium opener), 8pm sunday night, Braves, nat’l tv clear but cold.
  • 2007: 40,389 (in rfk, 1pm game vs Florida, 72degrees
  • 2006: 40,516 (in rfk, tuesday day game vs Mets, 72degr and sunny)
  • 2005: 45,596 (in rfk, debut of entire franchise, 62degr and clear, evening game).

Here’s some attendance milestones for the franchise:

  • Nats park capacity for 2017 somewhere between 41,506 and 41,546 depending on your source.
  • 2013’s opening day attendance of 45,274 remains the regular season record attendance.
  • All time record attendance?  The ill-fated 2012 NLDS game 5: 45,966.  No playoff games in 2014 or 2016 came close.
  • The first game in franchise history; 2005 in RFK: 45,596, which stood until the 2012 NLDS record-setting game.
  • The long-running regular season attendance record was the great Fathers day 2006 game in RFK against the Yankees: 45,157.  That record stood for more than 6 years.

Home Openers Box Scores and Results

Nats are 5-8 in their home openers now since moving to Washington.  Stephen Strasburg‘s 2017 start joins him with Livan Hernandez as the only two pitchers to throw more than one home opener for this team.  When Livan gets elected to Cooperstown, I hope he’s wearing the curly W.  🙂

  • 2017; mlb.com: Nats d Marlins 4-2.  WP: Strasburg, LP Phelps (Starters: Strasburg and Volquez)
  • 2016: mlb.com: Marlins d Nats 6-4.  WP: David Phelps, LP Tanner Roark (Starters: Brian Conley and Roark).
  • 2015: mlb.com: Mets d Nats 3-1.  WP: Bartolo Colon.  LP: Max Scherzer
  • 2014: mlb.com or b-r.com.  Braves d Nats 2-1.  WP: Luis Avilan.  LP: Tyler Clippard.  (Starters: Jordan Zimmermann and David Hale).
  • 2013: mlb.com or b-r.com.  Nats d Marlins 2-0.  WP: Stephen Strasburg.  LP: Ricky Nolasco
  • 2012: mlb.com.  Nats d Reds 3-2.  WP: Craig Stammen. LP: Alfredo Simon (Starters: Gio Gonzalez and Mat Latos)
  • 2011: mlb.com.  Braves d Nats 2-0.  WP: Derek Lowe.  LP: Livan Hernandez
  • 2010: mlb.com.  Phillies d Nats 11-1.  WP: Roy Halladay.  LP: John Lannan
  • 2009: mlb.com.  Phillies d Nats 9-8.  WP: Jamie Moyer.  LP: Saul Rivera (Nats Starter: Daniel Cabrera)
  • 2008: mlb.com.  Nats d Braves 3-2.  WP: Jon Rauch.  LP: Peter Moylan (Starters: Tim Hudson and Odalis Perez)
  • 2007: mlb.com.  Marlins d Nats 9-2.  WP: Dontrelle Willis.  LP: John Patterson
  • 2006: mlb.com.  Mets d Nats 7-1.  WP: Brian Bannister.  LP: Ramon Ortiz
  • 2005: mlb.com.  Nats beat Arizona 5-3. WP: Livan Hernandez. LP: Javier Vazquez

How about Season openers?

Record: 6-7.  # times home/away: 7 home, 6 away.

The Nats managed to lose 6 of their first 7 season openers … only winning in 2008 when debuting their new stadium.  And Jon Rauch did his darndest to blow that opener too, coughing up the lead in the 9th to give Ryan Zimmerman a chance at glory.


Opening Day Starter Trivia

Here’s my Opening Day starters worksheet in Google docs, updated for the 2017 slate.  Here’s the answer to some fun Opening Day Starter trivia:

  • Leader in Opening day starts: remains C.C. Sabathia with 11, though he’s not extending his record and will be caught next  year.
  • Leader in consecutive opening day starts: Felix Hernandez, making his 9th consecutive, 10th overall.
  • Justin Verlander returned to Opening Day duties, getting his 9th career opening day start; he remains in 3rd place actively.
  • Clayton Kershaw now has seven straight and may be in a position to challenge the all time records.
  • For the Nats; Stephen Strasburg gets his fourth.  Max Scherzer has two.  John Lannan, now back as a submarining lefty in AAA, also has two.
  • Twelve (12) pitchers made their first career opening day start in 2017, including (surprisingly) Yu Darvish.
  • Edinson Volquez got his 5th career opening day start … on four different teams.
  • The Mets have now used 7 different opening day starters in the last 7 seasons.  But that pales in comparison to what’s going on in Texas: 9 straight different opening day starters there.   Miami has used 6 different guys in a row and there’s a few other teams that have used 4 or 5 different guys over the last 4-5 seasons.
  • The most ever?  Tom Seaver with 16.  The most consecutive?  Jack Morris with 14.

Where would 2016 World Series Game 7 rank historically?

7 comments

Zobrist's  hit won it for the Cubs, and won him the series MVP award.  Photo via bleachereport

Zobrist’s hit won it for the Cubs, and won him the series MVP award. Photo via bleachereport

So, we just saw a pretty darn good World Series, culminating in a very good Game 7.  The Cubs win was obviously historic; no need to repeat all the other post-game analysis going on to that end.

The question here is; where does Game 7 rank historically?  We all suffer from recency bias, and many (most) of us were not around for such other classic games (1924 World Series game 7 going 12 innings and Walter Johnson pitching 4 innings on one day’s rest, 1960 game 7 featuring Mazeroski‘s famous walk-off homer, or Bobby Thompson‘s “Shot Heard ‘Round the World” to win the 1951 NL Pennant).  The normally sane Jayson Stark just posted that 2016’s Game 7 was “the Greatest ever game” in the long history of the sport.

However, I’m skeptical of calling *anything* that just happened, the best ever, so quickly after it ended.

On the “plus” side for its lofty status; Game 7 featured two long suffering franchises and was historic just on its own because of it.  It was a Game 7, which only happens about one in every four Series.  It went into extra innings, only the fifth time that’d ever happened.  It featured a clutch and improbable late inning comeback to tie a game that seemed out of reach (Rajai Davis‘ 8th inning homer off of Aroldis Chapman), and it ended with the tying run on base and the winning run at the plate for nail-biting.

On the “negative” side; it was a sloppy game (4 errors, 3 by the winning side) that featured decidedly “un-clutch” pitching performances by the two marquee relievers (Chapman and Andrew Miller), both patently exhausted from their workloads this post-season.  Neither starter even qualified for a decision.  The pitching in general was substandard; the teams combined for 24  hits and 15 runs; this is a far cry from Jack Morris‘ 10-inning shutout in the 1991 Game 7.  And thanks to the continuing trend of endless delays caused by interminable mound visits and bullpen switches, the game time (not even accounting for the rain delay) was nearly 4 and a half hours.

So, for me, no this wasn’t the greatest ever game.  But it was still darn good.  How good?


In 2011, just after the epic Game 6 between St. Louis and Texas, I posted a similar analysis; where did that game stand?  I put it into the context of the MLB TV’s 20 Greatest games of the last half century series, which ranked the best games since 1960 (but specifically NOT including the Mazeroski game, which may have been #1) as follows:

  • No. 20: May 17, 1979: Phillies @ Cubs; Phils, Cubs combine for 45 runs.  This is the only regular season game on the list and for good reason; the first inning alone had 13 runs scored.
  • No. 19: Oct. 4, 2003: Giants @ Marlins; future Nat Ivan Rodriguez tags out Eric Snow as he tries to bulldoze Pudge at the plate to end the game and send the Marlins to the World Series.
  • No. 18: Oct. 12, 1980: Phillies @ Astros; Phils win battle in 10th to win the NLCS with an epic comeback over Nolan Ryan.
  • No. 17: Oct. 17, 2004: Yankees @ Red Sox; Dave Roberts‘ stolen base and David Ortiz‘s walk-off homer cap the Boston win, an epic part of the Boston comeback from 3-0 down in the 2004 ALCS.
  • No. 16: Oct. 6, 2009: Tigers @ Twins; Twins win a game 163 sudden death playoff game for the AL Central title.
  • No. 15: Oct. 8, 1995: Yankees @ Mariners; Edgar Martinez hits “The Double” to get a walk-off win in the ALDS, capping a 10th inning comeback as a young Ken Griffey Jr absolutely flies around the bases to score from first.
  • No. 14: Oct. 23, 1993: Phillies @ Blue Jays; Joe Carter‘s walk-off WS homer foils a great Philly comeback.
  • No. 13: Oct. 26, 1997: Indians @ Marlins; Edgar Renteria wins it for Fish in a World Series game 7 classic.
  • No. 12: Oct. 31, 2001: D-backs @ Yankees; Tino Martinez ties it with a 2-out, 2-run homer in the bottom of the 9th and Derek Jeter hits first November homer and earns himself the nickname for which he’s continued to be known.
  • No. 11: Oct. 2, 1978: Yankees @ Red Sox; Bucky Dent‘s improbable 3-run homer caps a massive October collapse for Boston and continues the legendary rivalry between the teams.
  • No. 10: Oct. 15, 1988: Athletics @ Dodgers; Injured slugger Kirk Gibson hits a pinch hit walk-off home run off of the dominant Dennis Eckersley for one of the most magical home runs in baseball history.
  • No. 9: Nov. 4, 2001: Yankees @ D-backs; Luis Gonzalez floats a ball over the drawn-in infield against Mariano Rivera to win a classic Game 7.
  • No. 8: Oct. 12, 1986: Red Sox @ Angels; Dave Henderson hits an improbable 3-run homer in the 9th to help Boston come back from 1-out away from elimination to eventually beat the Angels in the 86 ALCS.
  • No. 7: Oct. 14, 2003: Marlins @ Cubs; The infamous Steve Bartman game, which overshadowed an utter collapse by Mark Prior, Alex Gonzalez, the Cubs bullpen AND Kerry Wood the following day to continue the Cubs curse that lasted … until this week.
  • No. 6: Oct. 16, 2003: Red Sox @ Yankees; Aaron Boone suddenly homers off Tim Wakefield in extra innings to end a classic ALCS game 7 between the bitter rivals.
  • No. 5: Oct. 15, 1986: Mets @ Astros; Mets win in 16 as Jesse Orosco put in the relief performance of a lifetime.
  • No. 4: Oct. 14, 1992: Pirates @ Braves; the injured Sid Bream barely beats Barry Bonds‘ throw to score the series winner and effectively send the Pittsburgh franchise into a 20 year tailspin.
  • No. 3: Oct. 25, 1986: Red Sox @ Mets; Probably the most “infamous” game of all time, especially to Boston fans, as Bill Buckner‘s error follows a series of mishaps by the Red Sox pitching staff to turn a 10th inning 2 run lead into a game 6 loss.
  • No. 2: Oct. 27, 1991: Braves @ Twins; Jack Morris‘  seminal performance; a 1-0 10 inning shutout over the Braves in perhaps the best Game 7 of any World Series ever.
  • No. 1: Oct. 21, 1975: Reds @ Red Sox; the game forever known for Carlton Fisk waving his walk-off homer fair, but which should be known for the unbelievably clutch Bernie Carbo 8th inning homer to tie the game and enable the extra inning fireworks.

I put 2011 Game 6 fourth, just after the top 3 games above.  I think I rank 2016’s Game 7 slightly behind it, perhaps (and this would be rather ironic) just before or just after the Bartman game.  I think the top three games on this list are so iconic that they’d be hardpressed to beat, and we quickly forget just how amazing the 2011 game 6 was in terms of multiple improbable comebacks.

What say you?  How great do you think Game 7 was earlier this week?  Am I under-rating it?  Over-rating i?

Opening Day Payroll, Attendance, Starters & other cool stuff: 2016 Version

25 comments

2015 opening day image via sayhellobaseball.wordpress.com

2015 opening day image via sayhellobaseball.wordpress.com

My recurring “Opening Day” trivia/useless information post.  Here was 2015’s version, 2014‘s and 2013.  Many of the below links are to Google XLS docs that i’ve updated for 2016 and which are available on the right hand side under “NatsArm Creations.”


Nats 2016 Opening day Payroll: $145,178,886 according to Cots.  This is down nearly $20M from last year’s figure.  We can only hope that Mike Rizzo will be allowed to “spend” that money later in the year at the trade deadline if this team actually needs to spend money to acquire helpful players.

My personal payroll estimate came in at $ $137,286,029 coincidentally; why am I $8M off?  Because Cots basically makes arbitrary proclamations of salary for current year when money is deferred whereas I’m counting it as real dollars.  So for example I’m charging the Nats payroll precisely $15M for Max Scherzer this year while Cots puts the figure north of $22M, and Cots puts all of Papelbon’s $3M deferred 2016 salary on the 2016 books.  So between those two players the entire delta is accounted for.

The question is this: as a Nats fan are you “happy” that your payroll is down nearly $20M in Stephen Strasburg‘s walk  year and while your Season Ticket prices continue to rise?


Opening Day Payroll; MLB

USAToday also publishes opening day salaries for teams and i’m convinced that they’re garbage.  I’ve got a comparison spreadsheet where i’ve put the USAtoday figures side-by-side with Cots’ analysis and for some teams they’re off by more than $25M.  The problem is that USAToday doesn’t count ANY payments handed to and from between teams, whereas Cots does a very detailed auditing of such money.

Nonetheless, here’s USAToday and Cots’ rankings for the 30 teams (this is my first time using this new Table plug in; head to Google XLS to read it if this is too difficult):

Cots RankUSA Today rankTeamOpening Day - USA TodayOpening Day - CotsDelta USAtoday-Cots
12Los Angeles Dodgers$221,288,380 $247,781,668 $26,493,288
21New York Yankees$222,997,792 $227,854,350 $4,856,558
33Detroit Tigers$194,876,481 $198,018,000 $3,141,519
44Boston Red Sox$188,545,761 $197,899,679 $9,353,918
56San Francisco Giants$172,253,778 $172,086,611 ($167,167)
67Chicago Cubs$154,575,168 $171,611,834 $17,036,666
713Los Angeles Angels$137,251,333 $164,673,333 $27,422,000
85Texas Rangers$186,038,723 $157,955,390 ($28,083,333)
98Baltimore Orioles$145,533,782 $147,693,713 $2,159,931
109St. Louis Cardinals$143,053,500 $145,553,500 $2,500,000
1111Washington Nationals$141,652,646 $145,178,886 $3,526,240
1210Seattle Mariners$141,683,339 $141,830,193 $146,854
1312Toronto Blue Jays$138,701,700 $136,782,027 ($1,919,673)
1414New York Mets$133,889,129 $135,188,085 $1,298,956
1515Kansas City Royals$131,487,125 $131,487,125 $0
1616Chicago White Sox$112,998,667 $114,498,667 $1,500,000
1717Colorado Rockies$112,645,071 $112,645,071 $0
1818Minnesota Twins$105,333,200 $105,333,700 $500
1920San Diego Padres$101,424,814 $100,759,500 ($665,314)
2019Pittsburgh Pirates$103,778,833 $99,945,500 ($3,833,333)
2123Arizona Diamondbacks$89,264,063 $98,172,683 $8,908,620
2221Houston Astros$94,893,700 $96,893,700 $2,000,000
2327Cleveland Indians$74,311,900 $96,304,400 $21,992,500
2422Cincinnati Reds$89,955,059 $89,871,228 ($83,831)
2525Philadelphia Phillies$83,980,000 $88,846,667 $4,866,667
2624Oakland Athletics$86,806,234 $86,806,234 $0
2729Atlanta Braves$69,005,791 $86,580,792 $17,575,001
2826Miami Marlins$77,314,202 $74,364,500 ($2,949,702)
2930Tampa Bay Rays$57,097,310 $66,681,991 $9,584,681
3028Milwaukee Brewers$69,282,737 $63,908,300 ($5,374,437)


Opening day Nats park attendance

Opening Day 2016 attendance was announced at 41,650.  That’s down more than 800 from last year (but still a sell-out).  Perhaps the rain forcast kept people away.   Here’s all our home openers in order with attendance, time of game, weather:

  • 2016: 41,650 (4:05 thursday game, 60 and 1.5hr rain delay)
  • 2015: 42,295 (4:05 monday game, 75 and gorgeous)
  • 2014: 42,834 (1:05 friday game, 50s and overcast)
  • 2013: 45,274 (1:05 monday game, 60 and beautiful)
  • 2012: 40,907 (1:05 thursday game 56, partly cloudy)
  • 2011: 39,055 (1:05 thursday game, 41 degrees and overcast)
  • 2010: 41,290 (1pm game monday, beautiful weather 80s and sunny): Phillies invasion
  • 2009: 40,386 (3pm game on a monday, chilly 53degr and overcast)
  • 2008: 39,389 (season and stadium opener), 8pm sunday night, Braves, nat’l tv clear but cold.
  • 2007: 40,389 (in rfk, 1pm game vs Florida, 72degrees
  • 2006: 40,516 (in rfk, tuesday day game vs Mets, 72degr and sunny)
  • 2005: 45,596 (in rfk, debut of entire franchise, 62degr and clear, evening game).

Here’s some attendance milestones for the franchise:

  • Nats park capacity for 2015 seems to still be 41,456 unless they announce an 2016 adjustment.
  • 2015’s opening day crowd wasn’t even close to 2013’s: 45,274.  That remains the regular season record attendance.
  • All time record attendance?  The ill-fated 2012 NLDS game 5: 45,966.
  • The first game in franchise history; 2005 in RFK: 45,596, which stood until the NLDS record-setting game.
  • The long-running regular season attendance record was the great Fathers day 2006 game in RFK against the Yankees: 45,157.  That record stood for more than 6 years.

Opening Day Box Scores and Results

Nats are just 4-8 in their home openers now since moving to Washington.  Just one guy has thrown more than one home opener for the Nats: Livan Hernandez When Livan gets elected to Cooperstown, I hope he’s wearing the curly W.  🙂

  • 2016: mlb.com: Marlins d Nats 6-4.  WP: David Phelps, LP Tanner Roark (Starters: Brian Conley and Roark).
  • 2015: mlb.com: Mets d Nats 3-1.  WP: Bartolo Colon.  LP: Max Scherzer
  • 2014: mlb.com or b-r.com.  Braves d Nats 2-1.  WP: Luis Avilan.  LP: Tyler Clippard.  (Starters: Jordan Zimmermann and David Hale).
  • 2013: mlb.com or b-r.com.  Nats d Marlins 2-0.  WP: Stephen Strasburg.  LP: Ricky Nolasco
  • 2012: mlb.com.  Nats d Reds 3-2.  WP: Craig Stammen. LP: Alfredo Simon (Starters: Gio Gonzalez and Mat Latos)
  • 2011: mlb.com.  Braves d Nats 2-0.  WP: Derek Lowe.  LP: Livan Hernandez
  • 2010: mlb.com.  Phillies d Nats 11-1.  WP: Roy Halladay.  LP: John Lannan
  • 2009: mlb.com.  Phillies d Nats 9-8.  WP: Jamie Moyer.  LP: Saul Rivera (Nats Starter: Daniel Cabrera)
  • 2008: mlb.com.  Nats d Braves 3-2.  WP: Jon Rauch.  LP: Peter Moylan (Starters: Tim Hudson and Odalis Perez)
  • 2007: mlb.com.  Marlins d Nats 9-2.  WP: Dontrelle Willis.  LP: John Patterson
  • 2006: mlb.com.  Mets d Nats 7-1.  WP: Brian Bannister.  LP: Ramon Ortiz
  • 2005: mlb.com.  Nats beat Arizona 5-3. WP: Livan Hernandez. LP: Javier Vazquez

How about Season openers?

Record: 5-7.  # times home/away: 6 home, 6 away.

The Nats managed to lose 6 of their first 7 season openers … only winning in 2008 when debuting their new stadium.  And Jon Rauch did his darndest to blow that opener too, coughing up the lead in the 9th to give Ryan Zimmerman a chance at glory.

2016: away: Nats d Braves 4-3.  WP Treinen, LP O’Flarity (starters Scherzer, Teheran)
2015: home: Mets d Nats 3-1.  WP: Bartolo Colon.  LP: Max Scherzer
2014: away: Nats d Mets 9-7.  WP Aaron Barrett, LP Familia (starters Strasburg, Dillon Gee)
2013: home: Nats d Marlins 2-0.  WP: Stephen Strasburg.  LP: Ricky Nolasco
2012: away: Nats d Cubs 2-1.  WP Clippard, LP Marmol (starters: Strasburg and Ryan Dempster)
2011: home: Braves d Nats 2-0.  WP: Derek Lowe.  LP: Livan Hernandez
2010: home: Phillies d Nats 11-1.  WP: Roy Halladay.  LP: John Lannan
2009: away: Marlins d Nats 12-6.  WP: Nolasco, LP; Lannan
2008: home: Nats d Braves 3-2.  WP: Jon Rauch.  LP: Peter Moylan (Starters: Tim Hudson and Odalis Perez)
2007: home: Marlins d Nats 9-2.  WP: Dontrelle Willis.  LP: John Patterson
2006: away: Mets d Nats 3-2.  WP: Glavine, LP: Hernandez
2005: away: Phillies d Nats 8-4.  WP: Lieber, LP: Hernandez


Opening Day Starter Trivia

Here’s my Opening Day starters worksheet in Google docs.  Here’s the answer to some fun Opening Day Starter trivia:

  • Leader in Opening day starts: remains C.C. Sabathia with 11, though he’s missed the last two years.
  • Leader in consecutive opening day starts: Felix Hernandez, making his 8th consecutive, 9th overall.
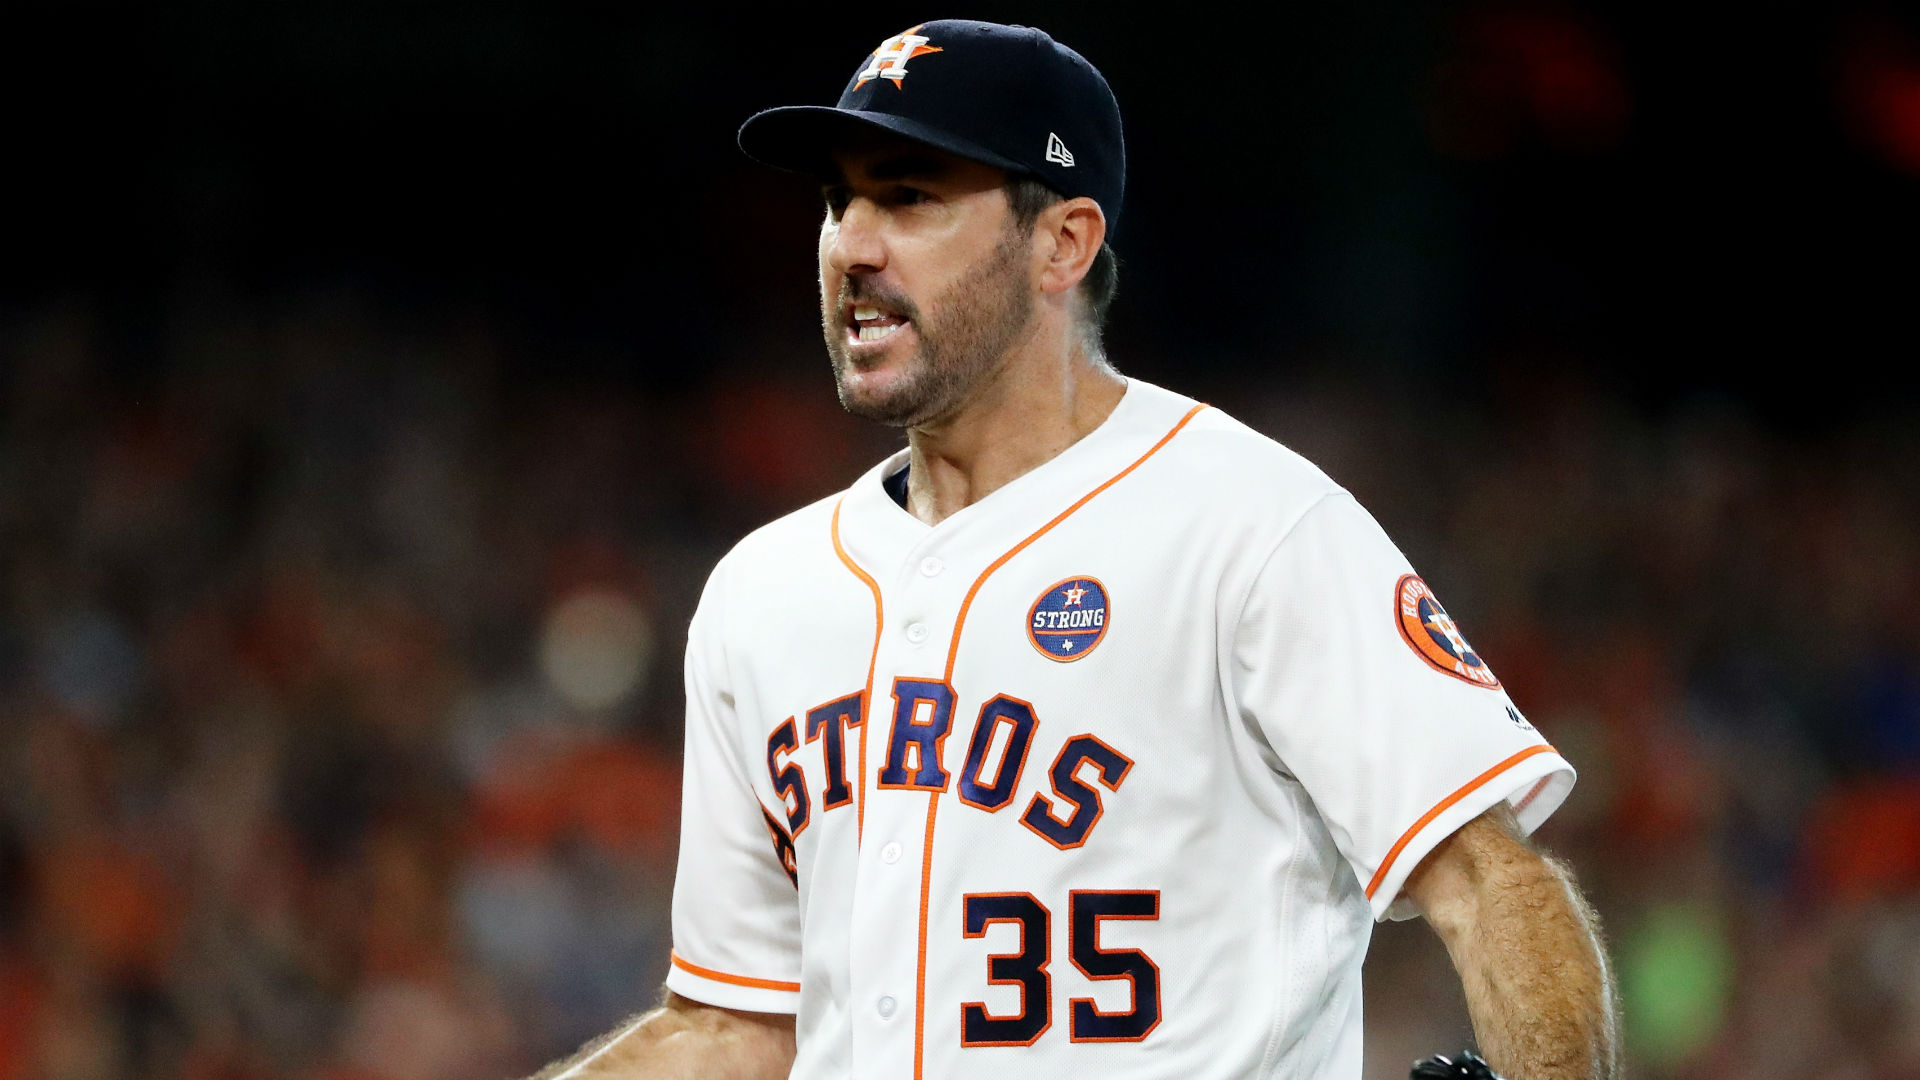
  • Justin Verlander returned to Opening Day duties, getting his 8th career opening day start; he remains in 3rd place actively.
  • For the Nats; Max Scherzer gets his 2nd and Stephen Strasburg continues to have three.
  • Ten (10) pitchers made their first opening day start in 2016.
  • There’s 8 guys out there still active with 4 or more Opening Day starts who did not get them this year, and they include a number of former Aces who might be on the way out of the game (Tim Lincecum in particular, but also guys like James Shields, Bartolo Colon and Yovanni Gallardo)
  • The most ever?  Tom Seaver with 16.  The most consecutive?  Jack Morris with 14.


Opening Day Payroll, Attendance, Starters & other cool stuff

6 comments

Harper's homer and subsequent hair flip was the highlight of the Nats opening day: photo via natsenquirer.com

Harper’s homer and subsequent hair flip was the highlight of the Nats opening day: photo via natsenquirer.com

Every year I try to attend Nats Opening Day.  Since giving up our season tickets, we’ve had to pay (handsomely) for the opportunity, and yesterday was no exception.  For nostalga purposes, we bought into our old section (131) for the home opener and had a great time in the sun.  Too bad Ian Desmond had money on the game and enabled three unearned runs to score.  Oh and our first pinch hitter off the bench?  The powerful and feared Matt den Dekker.  So yeah, this team looks like it may struggle offensively for a bit.

Here’s some fun stuff that I have been tracking for years inre opening day.


Opening Day Payroll; Nats

Counting payroll is always a tough one.  I have a payroll tracking worksheet (now updated for our last three NRI additions and our opening day roster) where I have been trying to estimate the Nats payroll.

Why the discrepancies?   I can’t quite figure out how my and Cot’s estimates are off: I’m counting the $2M option year buyout to Adam LaRoche, while Cots does not.  Taking that out, i’d still be off by about the same amount, only to the wrong side.  My guess is that Cots is missing a min-salary guy somewhere.  Meanwhile USA Today’s estimate is counting the entirety of Dan Uggla‘s 2015 salary of $13.5M towards Washington’s total; If you took that away except for the MLB min portion Washington is responsible for you’d be at $161,518,497 as their estimate.  USA Today’s numbers also don’t take into account the nearly $40 million dollars (net) that the Dodgers are paying players who no longer play for them; their payroll (per USA Today’s estimates) should really be nearer the $270M range.

You know what they say; a few million here, a few million there, and soon you’re talking about real money.


Opening Day Payroll; MLB

Here’s a quickie little XLS where I have the opening day payroll for all 30 teams going back 5 years.  Caveat; I usually depend on the USAToday salary database for these numbers, which have proved to have some issues (as discussed above).

USAToday has the Dodgers at $230M, but that’s before another $40M of payments to former players.  Cots has the Dodgers at $271M, a more accurate figure.  That’s first place by a significant margin.  In second place is the Yankees: $213M-$217M for a team that many feel will come in last last place.

I’m going to update this XLS for Cot’s figures, since USAToday’s are just so bad.


Opening day Nats park attendance

Attendance for yesterday’s game was announced at 42,295.  Here’s some attendance milestones for the franchise:

  • Nats park capacity for 2015 seems to be 41,456, an increase of 40 seats from last year
  • 2015’s opening day crowd wasn’t even close to 2013’s: 45,274.  That remains the regular season record attendance.
  • All time record attendance?  The ill-fated 2012 NLDS game 5: 45,966.
  • The first game in franchise history; 2005 in RFK: 45,596, which stood until the NLDS record-setting game.
  • The long-running regular season attendance record was the great Fathers day 2006 game in RFK against the Yankees: 45,157.  That record stood for more than 6 years.


Opening Day Starters

Here’s my opening day starters worksheet in Google docs.  Thanks to some turnover at the top of some of these rotations, the two active leaders in Opening Day starts (CC Sabathia and Mark Buehrle) did not extend their leads of 11 and 9 respectively.  The names of note for opening day starts:

  • Leader in Opening day starts who extended their total in 2015: Felix Hernandez, making his 8th.
  • Leader in consecutive opening day starts: also Hernandez, making his 7th total (he missed one earlier in his career).
  • Four pitchers now have 7 opening day starts on their resume: Bartolo Colon, Jered Weaver, James Shields and Justin Verlander.  Verlander’s streak of 7 consecutive starts was broken when he was supplanted by David Price for 2015.  Of these four, it seems likely only that Shields will continue.
  • 12 pitchers made their first opening day start in 2015, including our own Max Scherzer.
  • The most ever?  Tom Seaver with 16.  The most consecutive?  Jack Morris with 14.


cool stuff