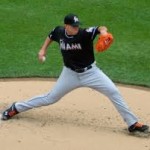
Nationals Arm Race

"… the reason you win or lose is darn near always the same – pitching.” — Earl Weaver

Archive for the ‘nolan ryan’ tag

Where would 2017 World Series Games 2 or 5 rank historically?

13 comments

This beat my marriage proposal. Photo via sbnation

This beat my marriage proposal. Photo via sbnation

What a World Series!  I predicted Houston would win in 6 primarily because I thought Kershaw would get the series back to LA by winning Game 5, but Verlander  would shut it down in the 6th game.  Didn’t quite happen that way, with both guys pitching well but not getting the result that night.   In the end, I honestly think the better team won this series, and Houston’s bottoming-out gambit has now paid off with the first title in their existence.

What i’m wondering about now is this: two of these World Series games we just saw were just amazingly good games, featuring massive comebacks, late inning heroics, clutch homers, walk-off hits.

Where, if anywhere, do they rank in the pantheon of “Greatest Games?”

I like to use as a jumping off point the excellent MLB.tv series “MLB’s 20 Greatest Games.”   A link to their web page with videos of each game is here.  The list is here:

  • No. 20: May 17, 1979: Phillies @ Cubs; Phils, Cubs combine for 45 runs.  This is the only regular season game on the list and for good reason; the first inning alone had 13 runs scored.
  • No. 19: Oct. 4, 2003: Giants @ Marlins; Ivan Rodriguez tags out Eric Snow as he tries to bulldoze Pudge at the plate to end the game and send the Marlins to the World Series.
  • No. 18: Oct. 12, 1980: Phillies @ Astros; Phils win battle in 10th to win the NLCS with an epic comeback over Nolan Ryan.
  • No. 17: Oct. 17, 2004: Yankees @ Red Sox; Dave Roberts‘ stolen base and David Ortiz‘s walk-off homer cap the Boston win, an epic part of the Boston comeback from 3-0 down in the 2004 ALCS.
  • No. 16: Oct. 6, 2009: Tigers @ Twins; Twins win a game 163 sudden death playoff game for the AL Central title.
  • No. 15: Oct. 8, 1995: Yankees @ Mariners; Edgar Martinez hits “The Double” to get a walk-off win in the ALDS, capping a 10th inning comeback as a young Ken Griffey Jr absolutely flies around the bases to score from first.
  • No. 14: Oct. 23, 1993: Phillies @ Blue Jays; Joe Carter‘s walk-off WS homer foils a great Philly comeback.
  • No. 13: Oct. 26, 1997: Indians @ Marlins; Edgar Renteria wins it for Fish in a World Series game 7 classic.
  • No. 12: Oct. 31, 2001: D-backs @ Yankees; Tino Martinez ties it with a 2-out, 2-run homer in the bottom of the 9th and Derek Jeter hits first November homer and earns himself the nickname for which he’s continued to be known.
  • No. 11: Oct. 2, 1978: Yankees @ Red Sox; Bucky Dent‘s improbable 3-run homer caps a massive October collapse for Boston and continues the legendary rivalry between the teams.
  • No. 10: Oct. 15, 1988: Athletics @ Dodgers; Injured slugger Kirk Gibson hits a pinch hit walk-off home run off of the dominant Dennis Eckersley for one of the most magical home runs in baseball history.
  • No. 9: Nov. 4, 2001: Yankees @ D-backs; Luis Gonzalez floats a ball over the drawn-in infield against Mariano Rivera to win a classic Game 7.
  • No. 8: Oct. 12, 1986: Red Sox @ Angels; Dave Henderson hits an improbable 3-run homer in the 9th to help Boston come back from 1-out away from elimination to eventually beat the Angels in the 86 ALCS.
  • No. 7: Oct. 14, 2003: Marlins @ Cubs; The infamous Steve Bartman game, which overshadowed an utter collapse by Mark Prior, Alex Gonzalez, the Cubs bullpen AND Kerry Wood the following day to continue the Cubs curse that lasts til today.
  • No. 6: Oct. 16, 2003: Red Sox @ Yankees; Aaron Boone suddenly homers off Tim Wakefield in extra innings to end a classic ALCS game 7 between the bitter rivals.
  • No. 5: Oct. 15, 1986: Mets @ Astros; Mets win in 16 as Jesse Orosco put in the relief performance of a lifetime.
  • No. 4: Oct. 14, 1992: Pirates @ Braves; the injured Sid Bream barely beats Barry Bonds‘ throw to score the series winner and effectively send the Pittsburgh franchise into a 20 year tailspin.
  • No. 3: Oct. 25, 1986: Red Sox @ Mets; Probably the most “infamous” game of all time, especially to Boston fans, as Bill Buckner‘s error follows a series of mishaps by the Red Sox pitching staff to turn a 10th inning 2 run lead into a game 6 loss.
  • No. 2: Oct. 27, 1991: Braves @ Twins; Jack Morris‘  seminal performance; a 1-0 10 inning shutout over the Braves in perhaps the best Game 7 of any World Series ever.
  • No. 1: Oct. 21, 1975: Reds @ Red Sox; the game forever known for Carlton Fisk waving his walk-off homer fair, but which should be known for the unbelievably clutch Bernie Carbo 8th inning homer to tie the game and enable the extra inning fireworks.

That’s a great list.  It technically should have been titled “Greatest 20 games of the last half century” since it skipped the classic 1960 Mazeroski game.

Since this series debuted, we’ve seen several really good post season games that I thought should be considered

  • 2011 Game 6: I thought it was a top 5 game when I saw it live, and i’d put it 4th or so on the above list.
  • 2016 Game 7:  I thought it was perhaps in the 5-10 range, putting it just after the Bartman game at #8 in the above list.
  • 2011 final Game of the season: Yankees@Rays: the Red Sox had blown a 9-game lead as of the beginning of the month, culminating with a blown save in the 9th of the final game of the season to open the door for Tampa.  meanwhile, Tampa was hosting the Yankees … and were down 7-0 in the 7th inning before rallying to tie the game, then win it in the 12th on a solo walk-off by super star Evan Longoria just minutes after hearing that the Red Sox had lost.  See the video to watch it  unfold; its pretty unbelievable.
  • 2007 NL Wild Card tiebreaker: Colorado beats San Diego 9-8 in 13 innings by rallying from 2 runs down to walk-off in a controversial play at the plate.

Well, where do you possibly put the two crazy games we just saw in this series?

  • 2017 Game 2: Houston scores in the 8th and 9th to push the game to Extras, blasts two solo homers in the 10th only to have LA tie the game in the bottom of the 10th.  Eventual MVP Springer blasts another homer in the 11th, and LA counters in the bottom of the 11th but falls short.  7 of the 13 runs scored in the game occurred in the extra innings and the teams set a WS record hitting 8 combined homers.
  • 2017 Game 5: Houston made up deficits of 3 and 4 runs early, LA scored 3 in the 9th to force extras, and Houston walked-off a win in the 10th to win a crazy 13-12 5 hour marathon.   As ESPN’s David Schoenfield said, “you thought game 2 was crazy?  Try game 5.

First off; were these truly “great games?”  One game was 7-6, the other was 13-12.  Both featured a ton of hitting and offense obviously, but not a ton of good pitching necessarily.  LA used NINE pitchers in Game 2, and the teams combined to use 14 pitchers in game 5 with neither starter getting out of the 5th.  Game 5 in particular featured both team’s Aces (Kershaw and Keuchel), both former Cy Young winners who both got blasted, and both team’s best reliever (Jansen and Devenski) got hit hard as well.  Some people think a “great game” includes transcendent performances on both sides of the ball, and both of these games were not the case.

Would you put either game into the above list?  I would.  I’d probably choose Game 2 over Game 5 given its late-inning heroics and slightly better pitching, and I’d probably put it in the 15-20 range in the above list.

What do you guys think?

Where would 2016 World Series Game 7 rank historically?

7 comments

Zobrist's  hit won it for the Cubs, and won him the series MVP award.  Photo via bleachereport

Zobrist’s hit won it for the Cubs, and won him the series MVP award. Photo via bleachereport

So, we just saw a pretty darn good World Series, culminating in a very good Game 7.  The Cubs win was obviously historic; no need to repeat all the other post-game analysis going on to that end.

The question here is; where does Game 7 rank historically?  We all suffer from recency bias, and many (most) of us were not around for such other classic games (1924 World Series game 7 going 12 innings and Walter Johnson pitching 4 innings on one day’s rest, 1960 game 7 featuring Mazeroski‘s famous walk-off homer, or Bobby Thompson‘s “Shot Heard ‘Round the World” to win the 1951 NL Pennant).  The normally sane Jayson Stark just posted that 2016’s Game 7 was “the Greatest ever game” in the long history of the sport.

However, I’m skeptical of calling *anything* that just happened, the best ever, so quickly after it ended.

On the “plus” side for its lofty status; Game 7 featured two long suffering franchises and was historic just on its own because of it.  It was a Game 7, which only happens about one in every four Series.  It went into extra innings, only the fifth time that’d ever happened.  It featured a clutch and improbable late inning comeback to tie a game that seemed out of reach (Rajai Davis‘ 8th inning homer off of Aroldis Chapman), and it ended with the tying run on base and the winning run at the plate for nail-biting.

On the “negative” side; it was a sloppy game (4 errors, 3 by the winning side) that featured decidedly “un-clutch” pitching performances by the two marquee relievers (Chapman and Andrew Miller), both patently exhausted from their workloads this post-season.  Neither starter even qualified for a decision.  The pitching in general was substandard; the teams combined for 24  hits and 15 runs; this is a far cry from Jack Morris‘ 10-inning shutout in the 1991 Game 7.  And thanks to the continuing trend of endless delays caused by interminable mound visits and bullpen switches, the game time (not even accounting for the rain delay) was nearly 4 and a half hours.

So, for me, no this wasn’t the greatest ever game.  But it was still darn good.  How good?


In 2011, just after the epic Game 6 between St. Louis and Texas, I posted a similar analysis; where did that game stand?  I put it into the context of the MLB TV’s 20 Greatest games of the last half century series, which ranked the best games since 1960 (but specifically NOT including the Mazeroski game, which may have been #1) as follows:

  • No. 20: May 17, 1979: Phillies @ Cubs; Phils, Cubs combine for 45 runs.  This is the only regular season game on the list and for good reason; the first inning alone had 13 runs scored.
  • No. 19: Oct. 4, 2003: Giants @ Marlins; future Nat Ivan Rodriguez tags out Eric Snow as he tries to bulldoze Pudge at the plate to end the game and send the Marlins to the World Series.
  • No. 18: Oct. 12, 1980: Phillies @ Astros; Phils win battle in 10th to win the NLCS with an epic comeback over Nolan Ryan.
  • No. 17: Oct. 17, 2004: Yankees @ Red Sox; Dave Roberts‘ stolen base and David Ortiz‘s walk-off homer cap the Boston win, an epic part of the Boston comeback from 3-0 down in the 2004 ALCS.
  • No. 16: Oct. 6, 2009: Tigers @ Twins; Twins win a game 163 sudden death playoff game for the AL Central title.
  • No. 15: Oct. 8, 1995: Yankees @ Mariners; Edgar Martinez hits “The Double” to get a walk-off win in the ALDS, capping a 10th inning comeback as a young Ken Griffey Jr absolutely flies around the bases to score from first.
  • No. 14: Oct. 23, 1993: Phillies @ Blue Jays; Joe Carter‘s walk-off WS homer foils a great Philly comeback.
  • No. 13: Oct. 26, 1997: Indians @ Marlins; Edgar Renteria wins it for Fish in a World Series game 7 classic.
  • No. 12: Oct. 31, 2001: D-backs @ Yankees; Tino Martinez ties it with a 2-out, 2-run homer in the bottom of the 9th and Derek Jeter hits first November homer and earns himself the nickname for which he’s continued to be known.
  • No. 11: Oct. 2, 1978: Yankees @ Red Sox; Bucky Dent‘s improbable 3-run homer caps a massive October collapse for Boston and continues the legendary rivalry between the teams.
  • No. 10: Oct. 15, 1988: Athletics @ Dodgers; Injured slugger Kirk Gibson hits a pinch hit walk-off home run off of the dominant Dennis Eckersley for one of the most magical home runs in baseball history.
  • No. 9: Nov. 4, 2001: Yankees @ D-backs; Luis Gonzalez floats a ball over the drawn-in infield against Mariano Rivera to win a classic Game 7.
  • No. 8: Oct. 12, 1986: Red Sox @ Angels; Dave Henderson hits an improbable 3-run homer in the 9th to help Boston come back from 1-out away from elimination to eventually beat the Angels in the 86 ALCS.
  • No. 7: Oct. 14, 2003: Marlins @ Cubs; The infamous Steve Bartman game, which overshadowed an utter collapse by Mark Prior, Alex Gonzalez, the Cubs bullpen AND Kerry Wood the following day to continue the Cubs curse that lasted … until this week.
  • No. 6: Oct. 16, 2003: Red Sox @ Yankees; Aaron Boone suddenly homers off Tim Wakefield in extra innings to end a classic ALCS game 7 between the bitter rivals.
  • No. 5: Oct. 15, 1986: Mets @ Astros; Mets win in 16 as Jesse Orosco put in the relief performance of a lifetime.
  • No. 4: Oct. 14, 1992: Pirates @ Braves; the injured Sid Bream barely beats Barry Bonds‘ throw to score the series winner and effectively send the Pittsburgh franchise into a 20 year tailspin.
  • No. 3: Oct. 25, 1986: Red Sox @ Mets; Probably the most “infamous” game of all time, especially to Boston fans, as Bill Buckner‘s error follows a series of mishaps by the Red Sox pitching staff to turn a 10th inning 2 run lead into a game 6 loss.
  • No. 2: Oct. 27, 1991: Braves @ Twins; Jack Morris‘  seminal performance; a 1-0 10 inning shutout over the Braves in perhaps the best Game 7 of any World Series ever.
  • No. 1: Oct. 21, 1975: Reds @ Red Sox; the game forever known for Carlton Fisk waving his walk-off homer fair, but which should be known for the unbelievably clutch Bernie Carbo 8th inning homer to tie the game and enable the extra inning fireworks.

I put 2011 Game 6 fourth, just after the top 3 games above.  I think I rank 2016’s Game 7 slightly behind it, perhaps (and this would be rather ironic) just before or just after the Bartman game.  I think the top three games on this list are so iconic that they’d be hardpressed to beat, and we quickly forget just how amazing the 2011 game 6 was in terms of multiple improbable comebacks.

What say you?  How great do you think Game 7 was earlier this week?  Am I under-rating it?  Over-rating i?

TJ Surgery epidemic: upbringing, showcases and mechanics

10 comments

Jose Fernandez is (arguably) the biggest name to go down to TJ surgery yet.  Photo via thestar.com

Jose Fernandez is (arguably) the biggest name to go down to TJ surgery yet. Photo via thestar.com

Its the biggest story in baseball so far in 2014.   We’ve had nearly 20 MLB pitchers get diagnosed with torn elbow ligaments so far this calendar year.  All of them have or are set to undergo “Tommy John” surgery (also known as ulnar collateral ligament/UCL replacement surgery).  That’s nearly as many as who got the surgery ALL of 2013 and we’re just 6 weeks into the season.  There’s an alarming trend upwards over just the past few seasons of pitchers getting this surgery.  There’s been plenty more minor leaguers (two Nats farmhands in Erik Davis and Danny Rosenbaum have already gotten it in 2014) and already a couple of very high-profile draft prospects as well (including as discussed in this space potential 1st rounders Jeff Hoffman and Erick Fedde just in the last week).

Lots of people are talking about this story, especially some heavy-weights in the baseball world.  A sampling:

  • Dr. James Andrews, perhaps the most famous sports doctor in the world, attributes the growing trend to the rise in year-round baseball competition in the US.
  • SI.com’s Jay Jaffe reviews Dr. Andrews comments and had other excellent stats about the trend in this April 2014 piece.
  • The Washington Post’s Dave Sheinin did an excellent piece in the paper a few weeks ago about the injury, which he attributes to youth usage.
  • Tom Verducci (he of the “Verducci effect”) proposed a solution in a column this week after the Jose Fernandez announcement.  His idea?  Lowering the mound across all levels of the sport.  He draws this conclusion after hosting a very interesting round-table on MLB Network.
  • Jayson Stark teamed up with ESPN injury analyst Stephania Bell and former player Alex Cora to discuss the rise in arm injuries in this ESPN.com video, and they follow Andrews’ theory of year-round pitching.
  • Chris O’Leary, king of the Inverted-W (whether you believe his theories or not, I’ve included this link here) has his own theories as discussed here.  He doesn’t really have much in the way of explanation, just more whining about how every pitcher’s mechanics has something you can complain about.
  • Jeff Passan basically calls out baseball executives for not having any answers.
  • If you want an index of all of ESPN.com’s stories on the topic, click here.  It will have columns, analysis and press releases for individuals getting the surgery.

Some interesting stats about Tommy John surgery:

So what the heck is going on??  Lets talk about some theories.  I’ll highlight them in Blue.

The new “hot theory” is essentially this: Over-throwing at Showcase events, which have become crucial scouting events for kids raised in the United States, are to blame.  Thanks to the rise in travel leagues and select teams, scouts spend less time sitting at high school games and more time at these all-star events.  To prescribers of this theory, it isn’t so much about the amount of innings or pitches that kids throw … its the nature of the “showcase” events and the high pressure situations that those events put kids under.  Kids are throwing year-round, and they’re ramping up max-effort pitches at national competitions multiple times per year, and in some cases out of “season.”  This leads to serious damage to kids’ arms done as 16 and 17 yr olds, which then manifests itself over the years and results in blown ligaments in pro ball.

Do you buy this explanation?  It certainly makes sense to me, but how do you prove this?  And, it doesn’t explain the similar rise in elbow injuries to non-American pitchers.

Is it less about the showcase events and more about the Larger Increase in Youth pitched innings thanks to the rise in Travel Leagues?   This theory also makes some sense to me: thirty years ago kids played an 18-20 game spring Little League season, at best would pitch half those games and that was it.  Maybe they played in the fall too, but there were specific innings limits in place that protected kids.  Now instead of playing limited spring and fall seasons, kids are playing AAU travel teams that play 40-50 games a summer, plus weekend tournaments, plus (eventually) the above showcase events as they get closer to matriculation.  This theory certainly is supported by a startling rise in youth arm injuries, as noted in this 2010 study by the American Academy of Orthopaedic Surgeons.

But, if its “bad” to play more baseball … then shouldn’t we be seeing even MORE injuries from players who grew up in third-world baseball hot beds like the Dominican Republic or Venezuela, where by all accounts kids play baseball from sun-up to sun-down 12 months out of the year in tropical climates?

Interestingly, of the list of 19 MLB players so far who have been diagnosed with a torn UCL (see next section), there’s 4 non-American developed pitchers (Rondo, Nova, Figueora, Cisnero).  4 of 19 = 21%, whereas about 22% of MLB pitchers are non-American developed (my 22% figure comes from this quick study that I did; I grabbed every active MLB pitcher as of early May 2014 and did a quick-and-dirty player upbringing analysis to determine that about 78% of players “grew up” in the current American system of player development).  It is small sample size … but the percentage of american versus foreign developed players are so far exactly in line with the total percentage of each type of player in the larger pool of MLB pitchers.  This doesn’t seem to support either of the two above theories.

We’ve all heard horror stories about pitch counts and pitcher abuse at  high school events in Japan (this came to light over the winter as we looked at Masahiro Tanaka and learned about these Japanese showcase events; this article here at thebiglead.com talks about one Japanese prospect’s 772 pitches thrown over 9 days, and Jeff Passan talked about Tanaka’s own pitch count abuse stories and his average pitch counts as a Japanese-league pro).   Unfortunately there’s not a ton of data available about this TJ theory and Japanese pitchers.  I can find a couple of instances of Asian pitchers getting the surgery (Kyuji Fujikawa in 2012 being the most recent example), but not enough to establish any trends.

But lets state it this way: you can’t have things both ways.  Both these stereotypes about player upbringing cannot be true:

  • Latin American poor youth plays baseball from sun up to sun down 12 months a year, building arm strength constantly, therefore his arm is “stronger” and he’s less suceptible to injury
  • American little leaguer plays limited schedules (18 games in the spring, perhaps fewer in the fall), has closely monitored pitch counts, therefore does not abuse his arm as a youth and thus his arm is “stronger” later in life as a result.

Here’s a list of the 19 MLB pitchers who have already gone under the TJ knife so far in 2014 (data from baseballheatmaps.com, which has detailed Disabled List data).

Of these 19 pitchers, they are evenly split between being starters (10) and relievers (9).  So that doesn’t seem to lend itself to any Starter vs Reliever usage conclusion.

How about Pitching Mechanics?  We’ve all heard ad-naseum about the “Inverted W” and people talking about pronation and timing and elbow lift and etc etc.  Here’s a quick attempt to analyize the mechanics of each of these 19 guys (all photos grabbed as thumbnails from google images for the purposes of demonstration; no copyright infringement intended).

CisnerJose landingFernandezJose landingGriffinAJ landingFigueroaPedro landing


NovaIvan landingJohnsonJosh landingMooreMatt landingGearrinCory landing


ParnellBobby landingDavisErik landingHernandezDavid landingMLB: Spring Training-Arizona Diamondbacks at Los Angeles Dodgers


RondonBruce landingCorbinPatrick landingParkerJarrod landingBeachyBrandon landing


MedlenKris landingHochevarLuke landingLeubkeCory landing2

Quick and Dirty Mechanics analysis (images in same order as list of pitchers above, which is choronological in order of diagnosis in 2014):

  • Inverted W: Griffin, Nova, Gearrin, Beachy, Hochevar
  • Sideways M: Fernandez, Johnson, Davis, Moylan, Rondon, Parker, Medlen
  • Inverted L: Cisnero, Figueroa, Moore, Parnell, Hernandez, Corbin, Luebke

But I’ll immediately add a caveat to these classifications; at various stop-points in a guy’s delivery, he may exhibit “good” or “bad” trends.   Maybe some of these “sideways-M” guys are actually “inverted-W” guys.  Maybe some of these inverted-W guys are ok and the stills make their mechanics seem worse than they are.

Nonetheless; there’s no trend among the 19 guys in terms of their mechanics.  In some cases they’re “bad” (Griffin and Gearrin’s look awful) but in some cases excellent (nobody should look at Moore’s mechanics and say they’re anything but clean, nor with Parnell or Corbin).  These pitchers are overhanders, 3/4-slot guys and even side-armers/submarine guys (Gearrin and Moylan).   These guys include hard throwers (Rondon had the 3rd highest velocity of *any* pitcher in 2013) and softer-throwing guys (Medlen had one of the lowest fastball velocities in the majors in 2013).  There’s starters and relievers almost equally represented in this list.

Conclusion; there’s no conclusions to draw from pitching mechanics analysis.  I think all attempts to look at guys’ mechanics and make judgements are useless.  I think (as does Keith Law and other pundits in the field) that the “Inverted W” is nonesense and that “research” posted online by concerned-fathers-turned-self-appointed-mechanics-experts is not exactly trustworthy.  The fact of the matter is this: throwing a baseball over and over is hard on the body.  Throwing a ball is an unnatural motion, and throwing a ball at max-effort will eventually lead to pitching injuries, no matter what your mechanics.  They can be “good” or “bad” according to someone’s pet theory on bio-mechanics and it has nothing to do about whether a pitcher is going to throw 10 seasons without injury or have two tommy johns before they’re 25.

Some historical context for pitching mechanics arguments: the pitcher who has the 2nd most innings thrown in the non-knuckleballer modern era (behind Nolan Ryan) was Don Sutton.  Sutton displayed absolutely *classic* inverted-W mechanicsnever hit the D/L in his career and threw nearly 5,300 innings over the course of 23 seasons.   Walter Johnson‘s mechanics were awful; he slung the ball sideways as he literally pushed backwards away from the hitter at the end of his delivery.  If someone saw Johnson’s mechanics today they’d talk about how over-compensated he was on his shoulder and how he lost velocity thanks to landing stiff and having zero follow through.  Johnson only threw 5,900 innings in his pro career; yeah those mechanics really held him back.  Nolan Ryan was a freak of nature, throwing at that velocity for as long as he did.  The point?  You just don’t know.


Maybe there’s something to the “showcase abuse” theory for some players.   Maybe there’s something to the travel-ball overuse theory for some kids.  But I think the answer may be a bit more simple.  We all know there’s been a rise in the average MPH of fastballs in the majors, both on starters and especially with relievers.  My theory is simply this: kids who “can” throw upper 90s spend all their time trying to throw upper 90s/max effort fastballs 100% of the time, and human arms just cannot withstand that kind of abuse over and over.  In prior generations, kids who “could” throw that hard wouldn’t, or would rarely try to throw that hard, and thus suffered fewer elbow injuries.

Side note: I also firmly believe that we’re “victims of our own success” to a certain extent with respect to modern medicine; 30 years ago would someone have just “blown out their arm” instead of being diagnosed specifically with a “torn ulnar collateral ligament?”  Would some kid in the low minors who hurt his harm even bother to get an MRI?  How much of the rise in these injuries is simply the fact that we’re better at diagnosing injuries in the modern sports world?

Why are these kids trying to throw so hard these days?  Because velocity is king, and that’s what scouts look for.   A kid who “only” throws mid 80s as a 17-yr old is dismissed, while the kid who can throw mid 90s at the same age is fawned over.   Guys like Greg MaddoxMark Buehrle, and Tom Glavine probably don’t even get drafted in the modern baseball climate thanks to the over-focus on pure velocity.

You can talk about upbringing and showcase events and pitch counts and mechanics all you want, but I think it comes down to Pitcher over-exertion thanks to the rising trend of fastball velocity and the human nature urge of prospects and farm-hands to show more and more velocity so they can advance their careers.

What do you guys think?  Do you dismiss the “inverted-W” arguments like I do?  Do you think its all about showcase events?

Matt Harvey; just unlucky

7 comments

Harvey gets a really unfortunate diagnosis.  Photo: Brad Penner-USA TODAY Sports

Harvey gets a really unfortunate diagnosis. Photo: Brad Penner-USA TODAY Sports

What happened to Matt Harvey?
One of my friends speculated that his overuse at UNC may have contributed to his very unfortunate torn UCL/possible need for Tommy John surgery and drew a parallel to our own Stephen Strasburg in terms of young phenoms going down.  I don’t recall any accusations of overuse of Strasburg at SD State; in fact Tony Gwynn seemed to be hyper aware of the media outcry if there would have been overuse and handled him very carefully.   His workload in college was carefully monitored, the Nats brought him along very carefully and were hyper sensitive to any slight issues in his first pro years.  And Strasburg got hurt anyway.
UNC has a somewhat dim reputation among scouts for destroying pitcher arms (as does Texas, Rice, and a couple other programs), and you saw some evidence of that in this past CWS (where UNC’s “closer” suddenly was starting games and throwing 100s of pitches during the tournament after being a one-inning guy most of the year).  But Harvey left UNC in 2010.  A long time ago.
UCL tears are often point-source injuries; think about Strasburg’s torn UCL: he did it on one pitch.  Yes he probably “strained” the UCL before then (strain is medical term for “small tear” apparently, as we learned during the Lucas Giolito drafting), but it was very clear the exact moment Strasburg blew it out.  Meanwhile, shoulders seem to be more degenerative over time from overuse.  There doesn’t seem to be any video of a single pitch that blew out Harvey’s UCL, and I’m sure there’s arguments and counter-examples against this, but my observations seem to support this.  One day pitchers are healthy, the next day they have a blown elbow ligament.
What else could have caused Harvey’s injury?
Pitch counts?  Harvey’s game logs this year aren’t egregious: a couple of 120 pitch games (studies have shown that 120 pitches is about the threshold for pitches in the majors before workload effects are demonstratble in subsequent starts).  Lots of games in the 100-110 range.  But that’s to be expected; he’s a big guy, a workhorse, always has been.
Innings thrown?  Here’s a concern area.  96 college innings in 2010, 135.2 in 2011, 169.1 in 2012 and 178.1 in 2013 before this injury.  You generally don’t want guys to increase workloads more than 20% per year (the “Verducci effect,” so to speak)  He increased his workload 28% from college to his first pro year and another 20% from his first pro year to his second.  He was well on his way this year to another 20% increase and was set to be shut down before this injury.  He was definitely a risk for ramping up his innings too fast.
Mechanics: no evidence of any trouble spots; his mechanics have always been clean.  He threw hard but he wasn’t considered a “max effort” guy.  Too bad for the “inverted W” conspiracy crowd; they can’t have another poster child for their internet meme which is usually ignored by scouts and baseball professionals.  (as you can tell, I don’t believe in the inverted W b.s. as being anything other than coincidental.  For every pitcher with an arm injury and inverted W mechanics you can 1) find a pitcher with inverted-W who has NO injury history or 2) find a pitcher with impeccable mechanics who suffers the same type of injuries that the inverted W supposedly caused).
Is it the  Travel-league/year round baseball that prospects these days have grown up in?   If anything, you’d think that year-round baseball would help these kids, not hurt them, by building up arm strength and building up the muscles surrounding the critical points in a throwing arm (ucl, rotator cuff, labrum, etc).  This goes counter to recent advice from Dr. James Andrews, who advised that kids need an off-season from baseball to allow their arm muscles to rest and regenerate from the abuse that pitching causes.  Of course, you could also counter argue it and say that “the arm only has so many bullets in it” and each pitch is one pitch closer to an injury.
The “right” answer is probably some combination of all of the above, as well as genetic bad luck.  Some guys have absolutely perfect mechanics and get injured (Harvey), some guys have perfect mechanics and throw 10,000 innings (say, Nolan Ryan), some guys have crummy mechanics and get away with it for a long time (think Don Sutton or someone like that).
On the bright side; Tommy John surgery is now somewhere between 85-90% success rate.  And these TJ surgeries actually improve the arm action.  An amazing stat was tweeted by Rob Neyer in the wake of the Harvey injury; of the 360 pitchers who have started games this year, 124 have had Tommy John surgery.  124 of 360!  That’s one out of every three major league starters in the game.  Our own Nats experience exactly matches this: of the 9 guys we’ve had start a game this year 3 have TJ surgeries in their history (Strasburg, Jordan Zimmermann, Taylor Jordan).  The surgery doesn’t just repair, it improves the arm stability and strength.  TJ pitchers often come back with more break on their curve because the elbow has been improved.  They don’t just staple the tendon in place; they drill holes in the bones to attach the tendon so its got a stronger bond than what was naturally there.
In any case, it really is unfortunate to see such a great young guy suffer an arm injury so soon.  Hopeful for a full recovery.  The baseball world is a better, more fun place with young aces like Harvey out there every 5 days.

Are players from the 1980s under-represented in the Hall of Fame?

16 comments

Can Jack Morris eventually be the first “1980s Starter” to make the Hall? Photo John Iacono via si.com

First off: I’m not a “small hall” guy.  (How can you, when looking at the litany of obscure players the Veteran’s Committee has already enshrined while the current ballot has literally a dozen names that you can make an argument for?)  So naturally I want to see enshrinement for a larger number of the “marquee” names in baseball’s history.  I view the Hall of Fame as a museum dedicated to the game, and recognizing all the eras of the game for better or for worse.  I’m for expanding the current ballot and If I had a vote i’d be maxing out the 10 names with a desire to put a couple more guys on.

I’m also distinctly of the opinion that maybe the era of baseball just prior to today’s is underrepresented in Cooperstown.  Specifically, my theory is that the massive boom in offense that the game has seen in the last 20 years coupled with a distinct shift in the way pitching staffs are managed has led to voters and fans to discount and dismiss the accomplishments of players specifically from the 1980s.

MLB.com has a show called “Prime 9,” where they list the best 9 players/teams related to certain topics.  Recently they showed the “Best 9 players of the 1980s” by position, and it led me to use that list as a starting point for a discussion of marquee players from the 1980s and to decide whether or not the decade is under represented in Cooperstown.

Here’s Prime 9’s top player by position and their Hall of Fame status.  Throughout this entire article, Blue == Hall of Fame players while Red == non-Hall of Fame Players.

  • RF: Dwight Evans: fell off HoF ballot on his 3rd attempt in 1999.  Max votes: 10.4% in 1998.
  • CF: Dale Murphy: fell of HoF ballot on his 15th attempt this year in 2013.  Max votes: 23.2% in 2000.
  • LF: Rickey Henderson: 1st ballot HoFamer in 2009 with 94.8% of the vote.
  • SS: Cal Ripken Jr: 1st ballot HoFamer in 2007 with 98.5% of the vote.
  • 3B: Mike Schmidt: 1st ballot HoFamer in 1995 with 96.5% of the vote.
  • 2B: Ryne Sandberg: 3rd ballot HoFamer in 2005 with 76.2% of the vote.
  • 1B: Don Mattingly: on current ballot, his 13th attempt.  Max votes: 28.2% in 2001, his first year on the ballot.
  • C: Gary Carter: 6th ballot HoFamer in 2003 with 78% of the vote.
  • SP: Jack Morris: on current ballot, his 14th attempt.  Max votes: 67.7% this year.

Four of the Nine players listed as “Best of the Decade” are not in the Hall of Fame.   I think there’s something wrong here.  I know Morris is incredibly polarizing and probably never gets in, while the other three guys (Evans, Murphy, Mattingly) each had knocks against them related to durability and peak that prevented them from being enshrined.  Perhaps these are future Veteran’s committee picks.

I know the above list is arguable; perhaps those players aren’t necessarily the “best” at their positions for the decade.  So lets talk about the leading candidates per position who didn’t make the Prime-9’s list, and their own HoF status.  The MLB show didn’t distinguish between SP and RPs so I’ve separated them out below, nor did they distinguish between the OF positions like they did for the team selected above.

I’ve included the guys in the above “Prime 9” list in the lists below for ease of analysis by position.

(Coincidentally; as you read the vote percentage totals, keep in mind that a voting percentage of less than 1% means that the player got only a handful of votes from the 500+ votes tallied each year, a woefully small number).

Outfielders:

  • Dwight Evans: fell off HoF ballot on his 3rd attempt in 1999.  Max votes: 10.4% in 1998.
  • Dale Murphy: fell of HoF ballot on his 15th attempt this year in 2013.  Max votes: 23.2% in 2000.
  • Rickey Henderson: 1st ballot HoFamer in 2009 with 94.8% of the vote.
  • Andre Dawson: 9th ballot HoFamer in 2010 with 77.9% of the vote.
  • Tim Raines: on current ballot, his 6th attempt.  Max votes: 52.2% this year.
  • Dave Parker: fell of HoF ballot on his 15th attempt this year in 2011.  Max votes: 24.5% in 1998.
  • Fred Lynn: fell off HoF ballot on his 2nd attempt in 1997.  Max votes: 5.5% in 1996.
  • Kirk Gibson: fell off HoF ballot on his 1st attempt in 2001 with only 2.5% of the voting.
  • Dave Winfield: 1st ballot HoFamer in 2001 with 84.5% of the vote.
  • Kirby Puckett: 1st ballot HoFamer in 2001 with 82.1% of the vote.
  • Tony Gwynn: 1st ballot HoFamer in 2007 with 97.6% of the vote.
  • Pedro Guerrero: fell off HoF ballot on his 1st attempt in 1998 with only 1.3% of the voting.
  • Jim Rice: 15th ballot HoFamer in 2009 with 76.4% of the vote.
  • Daryl Strawberryfell off HoF ballot on his 1st attempt in 2005 with only 1.2% of the voting.
  • Jack Clarkfell off HoF ballot on his 1st attempt in 1998 with only 1.5% of the voting.
  • Andy Van Slyke: fell off HoF ballot on his 1st attempt in 2001 without receiving a single vote.

This makes for 16 total outfielders on the “Best of the decade” list.  Of those 16 outfielders, 10 are not in the Hall of Fame.  Would you say that the position is under-represented in the Hall if only 6 outfielders from an entire decade of the sport are enshrined?   Maybe, maybe not.   To say nothing of the fact that 2 of these 6 HoFame 80s outfielders (Rice and Dawson) were heavily criticized upon enshrinement for being voted in based on remnants of “old man” statistics.

Jack Clark you say?  50 Career WAR.  That’s nothing to shake a stick at.  Higher than a number of Hall of Fame hitters.  I remember him being more of a power hitter than he turned out to be.  He just couldn’t stay healthy; only 5 seasons where he played close to a “full season” in 18 years in the league.   I remember him fondly from my childhood; my family is from San Francisco and I always rooted for the Giants as a kid.

Middle Infielders:

  • Cal Ripken Jr: 1st ballot HoFamer in 2007 with 98.5% of the vote.
  • Ryne Sandberg: 3rd ballot HoFamer in 2005 with 76.2% of the vote.
  • Garry Templetonfell off HoF ballot on his 1st attempt in 1998 with only 0.4% of the voting.
  • Ozzie Smith1st ballot HoFamer in 2002 with 91.7% of the vote.
  • Alan Trammellon current ballot, his 12th attempt.  Max votes: 36.8% last year.
  • Robin Yount1st ballot HoFamer in 1999 with 77.5% of the vote.
  • Lou Whitaker: fell off HoF ballot on his 1st attempt in 2001 with only 2.9% of the voting.
  • Dave Conceptionfell of HoF ballot on his 15th attempt this year in 2008.  Max votes: 16.9% in 1998.

Lots of baseball pundits have lamented Whitaker’s fate, while plenty others vociferiously argue for Trammell, who had the misfortune of being both the 2nd best offensive SS (to Ripken) and the 2nd best defensive SS (to Smith) of his era simultaneously, thus being overshadowed by both.   Conception was about an equal at the plate to Ozzie Smith but only about half the Gold Gloves, but still seems like he deserved a bit more credit than he got in the voting.

Third Basemen

  • Mike Schmidt: 1st ballot HoFamer in 1995 with 96.5% of the vote.
  • Wade Boggs: 1st ballot HoFamer in 2005 with 91.9% of the vote.
  • George Brett: 1st ballot HoFamer in 1999 with 98.2% of the vote.
  • Paul Molitor: 1st ballot HoFamer in 2004 with 85.2% of the vote.
  • Terry Pendleton: fell off HoF ballot on his 1st attempt in 2004 with only 0.2% of the voting.
  • Tim Wallachfell off HoF ballot on his 1st attempt in 2002 with only 0.2% of the voting.
  • Buddy Bellfell off HoF ballot on his 1st attempt in 1995 with only 1.7% of the voting.

Four first ballot hall of fame 3rd Basemen played in the era (even if most consider Molitor primarly a DH later in his career) which is saying something considering there are only 12 full time 3rd baseman in the Hall from all of history.  The all-star game starters for the entire decade were almost entirely Schmidt, Boggs and Brett.  The others I fully acknowledge are “stretches” but did each have several all-star appearances during the decade.

First Basemen

  • Don Mattingly: on current ballot, his 13th attempt.  Max votes: 28.2% in 2001, his first year on the ballot.
  • Steve Garvey: fell of HoF ballot on his 15th attempt this year in 2007.  Max votes: 42.6% in 1995.
  • Eddie Murray: 1st ballot HoFamer in 2003 with 85.3% of the vote.
  • Keith Hernandez: fell off HoF ballot on his 9th attempt in 2004.  Max votes: 10.8% in 1998.
  • Mark McGwireon current ballot, his 7th attempt.  Max votes: 23.7% in 2010.

Not much to say here: There seemed to be a definite lack of quality first basemen for the decade; only one is enshrined in the Hall.  Many of the all-star 1B appearances early in the decade went to aging stars Rod Carew and Pete Rose, who by that point in their long careers had been moved to first base for defensive purposes. McGwire’s issues are obvious (and he’s clearly more well known for his exploits in the 1990s, so its arguable if he even belongs in this 1980’s centric discussion).

Catchers

  • Gary Carter: 6th ballot HoFamer in 2003 with 78% of the vote.
  • Carlton Fisk2nd ballot HoFamer in 2000 with 79.6% of the vote.
  • Lance Parrishfell off HoF ballot on his 1st attempt in 2001 with 1.7% of the voting.
  • Benito Santiagofell off HoF ballot on his 1st attempt in 2011 with 0.2% of the voting.
  • Darrell Porterfell off HoF ballot on his 1st attempt in 1993 with zero (0) votes.
  • Tony Penafell off HoF ballot on his 1st attempt in 2003 with0.4% of the voting.
  • Bob Boonefell off HoF ballot on his 5th attempt in 2000. Max votes: 7.7% in 1996.
  • Terry Kennedyfell off HoF ballot on his 1st attempt in 1997 with exactly one (1) vote.

Yes, I’m really stretching for 1980s catchers.  Basically Carter made the all-star team every year for the NL while Fisk made half the All Star Starts for the AL during the same time.  The backups were generally catchers having a decent first half, many of whom never made an other all-star team.  Boone was better than you remember, hence his hanging around the bottom of the ballot for a few years.

Closers/Relievers

  • Lee Smith: on current ballot, his 11th attempt.  Max votes: 50.6% in 2012.
  • Bruce Sutter: 13th ballot HoFamer in 2006 with 76.9% of the vote.
  • Dennis Eckersley:  1st ballot HoFamer in 2004 with 83.2% of the vote.
  • Rich Gossage: 9th ballot HoFamer in 2008 with 85.8% of the vote.
  • Jeff Reardonfell off HoF ballot on his 1st attempt in 2000 with 4.8% of the voting.
  • Tom Henkefell off HoF ballot on his 1st attempt in 2004 with 0.6% of the voting.
  • Dan Quisenberryfell off HoF ballot on his 1st attempt in 1996 with 3.8% of the voting.
  • Kent Tekulvefell off HoF ballot on his 1st attempt in 1995 with 1.3% of the voting.
  • Willie Hernandezfell off HoF ballot on his 1st attempt in 1995 with 0.4% of the voting.

I’m not going to vociferously argue for Relievers/Closers to be inducted, since I think they’re mostly overrated in terms of their contributions to wins.  But I will say that a couple of these guys were far better than you remember.  Take Tom Henke: career 157 ERA+, which was better than either Sutter or Gossage PLUS he had more career saves (311 for Henke compared to 310 for Gossage and 300 for Sutter).   How exactly are two of these three guys Hall of Famers while Henke got exactly 6 votes out of 515 his first time on the ballot?   These voting patterns just seem drastically inconsistent.


All the above though pales in comparison to what we’re about to see.

Starters

  • Jack Morris: on current ballot, his 14th attempt.  Max votes: 67.7% this year.
  • Steve Carlton: 1st ballot HoFamer in 1994 with 95.6% of the vote.
  • Dave Stewart: fell off HoF ballot on his 2nd attempt in 2002.  Max votes: 7.4% in 2001.
  • Frank Violafell off HoF ballot on his 1st attempt in 2002 with 0.4% of the voting.
  • Rick Sutcliffefell off HoF ballot on his 1st attempt in 2000 with 1.8% of the voting.
  • Dave Steibfell off HoF ballot on his 1st attempt in 2004 with 1.4% of the voting.
  • Bob Welchfell off HoF ballot on his 1st attempt in 2000 with 0.2% of the voting.
  • Brett Saberhagen: fell off HoF ballot on his 1st attempt in 2007 with 1.3% of the voting.
  • Orel Hershiser: fell off HoF ballot on his 2nd attempt in 2007.  Max votes: 11.2% in 2006.
  • Dwight Goodenfell off HoF ballot on his 1st attempt in 2006 with 3.3% of the voting.
  • Mike Scott:  fell off HoF ballot on his 1st attempt in 1997 with 0.4% of the voting.
  • Rick Reuschelfell off HoF ballot on his 1st attempt in 1997 with 0.4% of the voting.
  • Fernando Valenzuelafell off HoF ballot on his 2nd attempt in 2004.  Max votes: 6.2% in 2003.
  • Nolan Ryan: 1st ballot HoFamer in 1999 with 98.8% of the vote.
  • Denny Martinez: fell off HoF ballot on his 1st attempt in 2004 with 3.2% of the voting.
  • Bert Blyleven14th ballot HoFamer in 2011 with 79.7% of the vote.
  • Jimmy Keyfell off HoF ballot on his 1st attempt in 2004 with 0.6% of the voting.
  • Ron Guidryfell off HoF ballot on his 9th attempt in 2002.  Max votes: 8.8% in 2000.
  • John Tudor: fell off HoF ballot on his 1st attempt in 1996 with 0.4% of the voting.
  • Roger Clemenson current ballot, his 1st attempt.  Max votes: 37.6% in 2013.

Here is where I think I really have a problem with the Hall of Fame treatment players in the 1980s; I think the entire generation of Starting Pitchers has been generally underrated and overlooked.  Look at this list of pitchers and look at the number of guys who failed to even stay on the ballot for more than one season.  Meanwhile, you can argue that the three guys who ARE on this list who are in the Hall of Fame (Carlton, Ryan and Blyleven) all actually “belong” to the 1970s; they just happened to have longer careers that bled into the 1980s.  Clemens appears here because his late 80s debut was so strong but clearly he’s a player of the 90s, and his reasons for non-inclusion thus far are obvious.

Do you mean to tell me that NONE of these other 1980’s starters merits inclusion to the Hall of Fame?  That an entire decade of starting pitchers doesn’t historically merit inclusion?  I’m not going to argue that all (or most) of these players belong, but it is kind of shocking that so many of the leading pitchers of that era were given so little consideration.

My biggest beef may be with Saberhagen.  Here’s the side-by-side stats of Saberhagen and a Mystery pitcher we’ll identify in a moment:

Wins Losses IP K’s ERA ERA+ bWAR
Saberhagen 167 117 2562 2/3 1715 3.34 126 56
Mystery Player 165 87 2324 1/3 2396 2.76 131 50.3

Pretty close, no?  Saberhagen contributed more WAR and was nearly this player’s equal in ERA+, which adjusts to the eras.  Mystery player’s W/L record is better … but then again, havn’t we learned that wins and losses are meaningless stats now?   A couple more facts here: Saberhagen won two Cy Young awards while the Mystery player won Three.  Saberhagen led the league in ERA just once while Mystery player did it 5 years in a row.

The Mystery player here (if you havn’t already guessed) is none other than Sandy Koufax.  Now, I’m certainly not saying that Saberhagen is the equal of Koufax, certainly not when you look at Koufax’s last 5 seasons or his 4 no-hitters.  My point is this: Koufax was a first ballot hall of famer … and Saberhagen got 7 votes out of 545 ballots.   Saberhagen may not be a Hall of Famer but he deserved to be in the discussion longer than he was.

Others have mentioned the lack of support for Dave Steib, who had a relatively similar statistical case to Saberhagen.  Similar career bWAR (53.5), similar ERA+ (122), and similar injury issues that curtailed his career.  Steib’s award resume isn’t as impressive (zero Cy Youngs but 7 All-Star appearances in his first 11 seasons), and he was basically done as an effective player by the time he was 33.

There are some other surprises on this list too.  Jimmy Key you say?  Go look at his career stats and you’ll be surprised just how good he was.  186-117, a 3.51 ERA (which sounds mediocre) but a career 122 ERA+.  A couple of stellar seasons (two 2nd place Cy Young votes).   I’m not saying he’s a hall of famer, but I am saying that he was better than you remember.  There’s absolutely pitchers in the Hall with worse ERA+ than Key’s.


Coincidentally, you can make the argument that many of these players really “belonged” to a different decade, if you wanted to really just focus this discussion on the 1980 decade.

  • Fisk, Boone, Conception, Parker, Lynn, Rice, Garvey, Carlton, Ryan, Reuschel and to a certain extent Winfield were really players who mostly “belong” in the 1970s.
  • Blyleven and Brett’s careers equally spanned both the 70s and 80s.
  • Gooden, Van Slyke, Puckett, McGwire, Clemens and Pendleton had careers that started the late 80s but who flourished mostly in the 1990s.

But, I think the point is made, especially when it comes to pitchers.  So I left all these players in.


Here’s a couple other ways to look at the best players of the 1980s.  Here’s a list of the top 20 positional players by “Win Shares” for the decade (data cut and pasted from an online forum).  As with above, blue=hall of famer while red indicates not.

1. Rickey Henderson 289
2. Robin Yount 274
3. Mike Schmidt 265
4. Eddie Murray 250
5. Tim Raines 246
6. Dale Murphy 244
7. Wade Boggs 237
8. Dwight Evans 230
9. George Brett 229
10. Keith Hernandez 221
11. Pedro Guerrero 221
12. Cal Ripken 219
13. Alan Trammell 219
14. Gary Carter 215
15. Jack Clark 213
16. Lou Whitaker 205
17. Andre Dawson 204
18. Ozzie Smith 204
19. Paul Molitor 198
20. Dave Winfield 193

Most HoFame pundits lament the lack of support for Raines specifically, but it is interesting to see how high up both Murphy and Evans fall on this list.

Now, here’s Pitcher WAR accumulated in the 1980s.  I took this data from a posting on BeyondtheBoxScore blog back in 2010, who was arguing (of course) why Jack Morris didn’t deserve to be in the hall of fame.  However, the table here also illustrates nicely who were really the best pitchers of the decade, and most of these guys are in the list above.

Rank Name bWAR From To Age Wins Losses
1 Dave Stieb 45.2 1980 1989 22-31 140 109
2 Bob Welch 35.1 1980 1989 23-32 137 93
3 Fernando Valenzuela 34.8 1980 1989 19-28 128 103
4 Bert Blyleven 34 1980 1989 29-38 123 103
5 Orel Hershiser 32.8 1983 1989 24-30 98 64
6 Roger Clemens 32.3 1984 1989 21-26 95 45
7 Nolan Ryan 30.8 1980 1989 33-42 122 104
8 Dwight Gooden 30.2 1984 1989 19-24 100 39
9 John Tudor 29.7 1980 1989 26-35 104 66
10 Bret Saberhagen 29 1984 1989 20-25 92 61
11 Charlie Hough 28.7 1980 1989 32-41 128 114
12 Jack Morris 27.9 1980 1989 25-34 162 119
13 Mario Soto 27.3 1980 1988 23-31 94 84
14 Teddy Higuera 27.3 1985 1989 26-30 78 44
15 Rick Sutcliffe 26.7 1980 1989 24-33 116 93
16 Rick Reuschel 25.7 1980 1989 31-40 97 82
17 Steve Carlton 25.6 1980 1988 35-43 104 84
18 Ron Guidry 25.5 1980 1988 29-37 111 72
19 Frank Viola 25.1 1982 1989 22-29 117 98
20 Dan Quisenberry 24.6 1980 1989 27-36 53 43
21 Mark Gubicza 24.6 1984 1989 21-26 84 67

I’m not sure why he ran this list to 21 players; perhaps he really likes Mark Gubicza.

Notice the same 3 names appear here as appeared above for Hall of Fame starters.  Also notice the surprisingly high appearances of players like Soto and Higuera; I didn’t even include them in the above analysis, perhaps providing my own bias because certainly I wouldn’t have included these two in any conversation about the best pitchers of the 80s.  But the point is now made statistically; of the 20 best pitchers by WAR for the entire decade, only 3 are enshrined in the Hall.

I havn’t done this analysis for other decades but I’d be surprised if other decades were so underrepresented.  Think about how many obvious hall of famers pitched in the 1990s;  Just off the top of my head: Clemens, Mussina, Maddux, Glavine, Smoltz, Johnson, Pedro, Schilling and perhaps eventually Hoffman and Rivera.   Maybe guys like Cone and Pettitte deserve more thought.  Lee Smith is still on the ballot.  That’s a lot of names for one decade as compared to what’s happened to the 1980s guys.


So, after all this, do we think the 1980s players are underrepresented in the Hall?  I count 17 positional players, 3 relievers and 3 starters from the era.  Perhaps the answer is, “there’s plenty of positional representation but the Starters are not fairly represented.”

Why are there so few starters from this era enshrined?  Did we just see a relatively mediocre time period in baseball with respect to starting pitchers?  Did we just get unlucky with the longevity and injury issues related to the best pitchers of the era (Hershiser, Saberhagen, Steib)?  Did changes in bullpen management that came about in the 90s (lefty-lefty matchups and more specialized relievers) combined with increasing awareness/sensitivety to pitch counts (100 pitches and you’re out) contribute to this fact?   If you’re a starter and the assumption is that you’re pitching 9 innings no matter what your pitch count is, you’re going to approach the game differently and pitch with a different level of effort than if you knew you were getting the hook after 100 pitches and/or in roughly the 6th or 7th inning.  Did this contribute to more mediocre-appearing ERAs for starters of this era?  Is that a good argument to use, as compared to 90s’ and modern pitchers who go all-out for 7 innings and then sit (versus starters of the 90s, who would often face the 3-4-5 of the opposing team a FOURTH time in the late innings while sitting on 140 pitches)?

What do you guys think?

Incentives, Salary and Steroid use in Baseball

3 comments

Hit home runs, make lots of money. Repeat. Photo unknown via deadspin.com

A viewing of the HBO special “Freakonomics,” which turns chapters of the popular book into little mini vignettes, along with a conversation with my father prompted me to investigate the aspects of human behavior with regard to incentives when considering the rise of Steroid use by major league baseball players in the late 1990s.  One of the overriding themes in Freakonomics is that any aspect of human behavior can be predicted by analyzing the incentives facing those persons when making a choice.

So the question here is, were the growing incentives to players in terms of rising baseball salaries directly tied to the growing use of Steroids in the mid 1990s?

Steroids had been around for many years prior to appearing en-masse in Baseball.  The most infamous use came from the East German Olympic teams during the late 70s and early 80s, who systematically doped their own athletes (mostly without the athlete’s knowledge) from 1971 until 1990.  But seemingly only after the 1988 Seoul Olympics saw sprinter Ben Johnson test positive for one steroid and admitted the use of a host of other Steroids, Testosterone and HGH substances did the “Steroid Era” in baseball start.  In fact, 1988 is also acknowledged as the beginning of the era in the Mitchell Report (per Section D of the Summary, pg SR-14).  However, I’d argue that the mainstream usage of Steroids didn’t occur for a few years after (see the rise of 45+ homer seasons below).

Here’s a chart of Mean and Median US household income from 1974-2010, with the Minimum and Maximum MLB salaries, the Average MLB salary, that MLB salary listed as a multiple of the US mean income, and the number of 45+ home run seasons seen per year:

Year Median Income: Current Dollars Mean Income: current dollars Minimum MLB Salary Maximum MLB Salary Average MLB Salary Avg MLB salary as multiple of Mean US income # of 45+ Homer Seasons
2012 $480,000 $32,000,000
2011 $414,000 $32,000,000 $3,305,393 0
2010 $49,445 $67,530 $400,000 $33,000,000 $3,297,828 49 1
2009 $49,777 $67,976 $400,000 $33,000,000 $3,240,206 48 3
2008 $50,303 $68,424 $390,000 $28,000,000 $3,154,845 46 1
2007 $50,233 $67,609 $380,000 $23,428,571 $2,944,556 44 4
2006 $48,201 $66,570 $327,000 $21,680,727 $2,866,000 43 5
2005 $46,326 $63,344 $316,000 $26,000,000 $2,632,655 42 5
2004 $44,334 $60,466 $300,000 $22,500,000 $2,486,000 41 4
2003 $43,318 $59,067 $300,000 $22,000,000 $2,555,000 43 4
2002 $42,409 $57,852 $300,000 $22,000,000 $2,383,000 41 4
2001 $42,228 $58,208 $300,000 $22,000,000 $2,264,000 39 9
2000 $41,990 $57,135 $200,000 $15,714,286 $1,987,000 35 4
1999 $40,696 $54,737 $200,000 $11,494,794 $1,726,000 32 6
1998 $38,885 $51,855 $200,000 $14,936,667 $1,378,000 27 9
1997 $37,005 $49,692 $200,000 $10,000,000 $1,314,000 26 3
1996 $35,492 $47,123 $200,000 $9,237,500 $1,101,000 23 6
1995 $34,076 $44,938 $109,000 $9,237,500 $1,094,000 24 1
1994 $32,264 $43,133 $100,000 $6,300,000 $1,154,000 27 0
1993 $31,241 $41,428 $100,000 $6,200,000 $1,062,000 26 3
1992 $30,636 $38,840 $100,000 $6,100,000 $1,012,000 26 0
1991 $30,126 $37,922 $100,000 $3,800,000 $845,383 22 0
1990 $29,943 $37,403 $100,000 $3,200,000 $589,483 16 1
1989 $28,906 $36,520 $60,000 $2,766,667 $489,539 13 1
1988 $27,225 $34,017 $60,000 $2,340,000 $430,688 13 0
1987 $26,061 $32,410 $60,000 $2,127,333 $402,579 12 3
1986 $24,897 $30,759 $60,000 $2,800,000 $410,517 13 0
1985 $23,618 $29,066 $60,000 $2,130,300 $368,998 13 0
1984 $22,415 $27,464 $30,000 $2,500,000 $325,900 12 0
1983 $20,885 $25,401 $30,000 $2,500,000 $289,000 11 0
1982 $20,171 $24,309 $30,000 $2,500,000 $245,000 10 0
1981 $19,074 $22,787 $30,000 $2,500,000 $195,500 9 0
1980 $17,710 $21,063 $30,000 $2,500,000 $146,500 7 1
1979 $16,461 $19,554 $16,000 $1,170,000 $121,900 6 3
1978 $15,064 $17,730 $16,000 $700,000 $97,800 6 1
1977 $13,572 $16,100 $16,000 $700,000 $74,000 5 1
1976 $12,686 $14,922 $16,000 $700,000 $52,300 4 0
1975 $11,800 $13,779 $16,000 $670,000 $44,676 3 0
1974 $250,000 $40,839 0

There’s several landmark seasons of note in terms of escalating Salaries through this list.  By year:

  • 1975 saw Catfish Hunter become the first “true” Free Agent subject to bidding wars among teams, and signed a 5yr/$3.35M deal with the Yankees that resulted in his league-leading salary to nearly triple the league leading salary from 1974.
  • 1979 saw Nolan Ryan become the first $1million/year player.
  • In 1982 George Foster became the first $2M/year player.
  • By 1989, Kirby Puckett became baseball’s first $3M/year player.
  • In 1992, Barry Bonds hit free agency on the heels of MVP seasons in Pittsburgh and more than doubled the previous high annual salary.
  • By 1996, salaries were rising quickly; Albert Belle signs a $10M/year contract.
  • 2001 saw Alex Rodriguez‘s infamous Texas contract kick in, paying him $22M/year, nearly $7M more per year than the next closest player (Kevin Brown, who signed baseball’s first 9-figure contract).
  • Rodriguez opted out of that same contract and re-negotiated the terms even higher with the Yankees, eclipsing the $30M/year mark by 2009.

Meanwhile, take note of the red-colored years of 1996 to 2001, the core of the Steroid Era.  1996 saw no less than Six players eclipse the 45 home run barrier, including Brady Anderson in a complete aberration year for the lead-off hitter (he hit 50 homers in 1996 but averaged just 19 per 162 game segment and never hit more than 24).  Suddenly in 1998 no less than Nine players eclipsed the mark, lead by the Mark McGwire/Sammy Sosa home-run hitting competition that transfixed the nation and “saved” baseball.  Too bad we now know what America didn’t know then; that both players were using Performance Enhancing drugs to beef up, help power out baseballs and take advantage of a slew of new ballparks that opened in the era that featured cozier dimensions and more offense.

By 2002, enough pressure from the front office towards the player’s union had taken place to start testing, leading to the infamous “anonymous survey” done of players in 2003 that resulted in “between 5-7%” of players testing positive, leading to mandatory testing in 2004.  By 2008 we were back down to homer levels not seen since the early 1990s, and baseball didn’t see a single player hit the 45 homer barrier in 2011.  But historically the damage has been done; the home run leader boards from the time period in question lists like a Who’s Who of steroid accusations, and a generation of middle-aged baseball writers who grew up idolizing the home run leaders of yesteryear now seems set to penalize these players for their drug usage (proven or otherwise, as with the Jeff Bagwell Hall of Fame case).

But, everything I just wrote is known narrative.  Lets talk about the explosion of baseball salaries as compared to the common man.  In 1975 the average MLB salary of $44k was a little more than 3-times the mean US household income, having risen only gradually over the years thanks to the Reserve clause and a non-existent players union.  It was a boon for owners, who kept salaries down and profits high.  But the low salaries also meant that most baseball players were considered “within reach” of the every-man in America.  Players weren’t paid such ridiculously high salaries that they essentially live in a different world from the fans (as is the case today with most professional athletes in this country): these players were considered “just like us” to a certain extent, and frequently had off-season jobs, working along side the same people who paid a few bucks for a bleacher seat to cheer them on.  “America’s Pastime” largely earned that title from being the only sport in town for most of the century, but was also helped along by the “within reach” argument.

By 1980, with the country in a severe recession and gas lines around the block, Joe Public slightly increased his average pay.  However, Baseball players, thanks to the breaking of the reserve clause and the rise of Free agency were seeing a boom in salary hikes.  By 1980, the average MLB wage was 9 times the median income in the country and a few ballplayers were making $1M/year.   This ratio of US income to MLB income grew slightly over the next decade; ten years on in 1990 the average MLB wage was just 16x the US income.  But changes were about to come.  In 1996 the MLB salary multiple was 23-times the US mean, but by 2001 it was nearly 40-times the US mean salary.  The average MLB salary more than doubled inside of these 5 years.  This change coincided exactly with the beginnings of the Steroid era and also mirror the 6 year stretch where the game saw its historical rise in home runs.

So the question is: is this coincidence?  Was the rise in steroid use driven by player’s desires to maximize their earning potential or was it vice-versa (i.e., players discovered steroids could escalate performance, started using and producing and that lead to the quick rise in payroll?)  Or was this all more attributable to weaker pitching driven by expansion and  smaller ball-parks?

I think you can make the case that home run hitters were highly compensated and were commercially the “heros” of the game (remember the “Chicks Dig the Long Ball” commercials?), and other players figured out that Steroids helped pack on muscle mass and enabled themselves to hit the ball further and faster (to say nothing of the fact that steroids enabled players to come back from injury faster and to stay stronger through the season by virtue of added muscle mass), and rode the trend.  Hit 40-45 home runs one year, sign a contract extension the next.  Suddenly the game found itself full of juiced up, highly compensated sluggers with a massive ethical problem.

What do you think?

Sources used:

Year Median Income: Current Dollars Mean Income: current dollars Minimum MLB Salary Maximum MLB Salary Average MLB Salary Avg MLB salary as multiple of Mean US income # of 45+ Homer Seasons
2012 $480,000 $32,000,000
2011 $414,000 $32,000,000 $3,305,393 0
2010 $49,445 $67,530 $400,000 $33,000,000 $3,297,828 49 1
2009 $49,777 $67,976 $400,000 $33,000,000 $3,240,206 48 3
2008 $50,303 $68,424 $390,000 $28,000,000 $3,154,845 46 1
2007 $50,233 $67,609 $380,000 $23,428,571 $2,944,556 44 4
2006 $48,201 $66,570 $327,000 $21,680,727 $2,866,000 43 5
2005 $46,326 $63,344 $316,000 $2,600,000 $2,632,655 42 5
2004 $44,334 $60,466 $300,000 $22,500,000 $2,486,000 41 4
2003 $43,318 $59,067 $300,000 $22,000,000 $2,555,000 43 4
2002 $42,409 $57,852 $300,000 $22,000,000 $2,383,000 41 4
2001 $42,228 $58,208 $300,000 $22,000,000 $2,264,000 39 9
2000 $41,990 $57,135 $200,000 $15,714,286 $1,987,000 35 4
1999 $40,696 $54,737 $200,000 $11,494,794 $1,726,000 32 6
1998 $38,885 $51,855 $200,000 $14,936,667 $1,378,000 27 9
1997 $37,005 $49,692 $200,000 $10,000,000 $1,314,000 26 3
1996 $35,492 $47,123 $200,000 $9,237,500 $1,101,000 23 6
1995 $34,076 $44,938 $109,000 $9,237,500 $1,094,000 24 1
1994 $32,264 $43,133 $100,000 $6,300,000 $1,154,000 27 0
1993 $31,241 $41,428 $100,000 $6,200,000 $1,062,000 26 3
1992 $30,636 $38,840 $100,000 $6,100,000 $1,012,000 26 0
1991 $30,126 $37,922 $100,000 $3,800,000 $845,383 22 0
1990 $29,943 $37,403 $100,000 $3,200,000 $589,483 16 1
1989 $28,906 $36,520 $60,000 $2,766,667 $489,539 13 1
1988 $27,225 $34,017 $60,000 $2,340,000 $430,688 13 0
1987 $26,061 $32,410 $60,000 $2,127,333 $402,579 12 3
1986 $24,897 $30,759 $60,000 $2,800,000 $410,517 13 0
1985 $23,618 $29,066 $60,000 $2,130,300 $368,998 13 0
1984 $22,415 $27,464 $30,000 $2,500,000 $325,900 12 0
1983 $20,885 $25,401 $30,000 $2,500,000 $289,000 11 0
1982 $20,171 $24,309 $30,000 $2,500,000 $245,000 10 0
1981 $19,074 $22,787 $30,000 $2,500,000 $195,500 9 0
1980 $17,710 $21,063 $30,000 $2,500,000 $146,500 7 1
1979 $16,461 $19,554 $16,000 $1,170,000 $121,900 6 3
1978 $15,064 $17,730 $16,000 $700,000 $97,800 6 1
1977 $13,572 $16,100 $16,000 $700,000 $74,000 5 1
1976 $12,686 $14,922 $16,000 $700,000 $52,300 4 0
1975 $11,800 $13,779 $16,000 $670,000 $44,676 3 0
1974 $250,000 $40,839 0

Nats Off-season News Items Wrap-up 12/31/11 edition

5 comments

Its Hall of Fame ballot time. Let the Jack Morris arguments start-up again. Photo John Iacono via si.com

This is your semi-weekly/periodic wrap-up of Nats and other baseball news that caught my eye.  With the approaching Hall of Fame nonsense, er I mean news cycle approaching, I’ll throw in a HoFame section.

Nationals In General

  • Transcribed from a radio interview by Tim Dierkes, here’s Mike Rizzo on CF and 1B.  This is the first time I’ve seen Rizzo mention NEXT year’s FA class in terms of looking for talent and it makes you wonder if we don’t already have our entire primary starting 15 set (8 out-field players, 5 starters and setup/closer) for 2012.   I can live with Jayson Werth in CF, since it opens up lots of FA possibilities in RF.  In fact, I smell a separate post coming…
  • Former Nat Lastings Milledge is going to Japan to try to resurrect his baseball career.
  • Scouting-specific SeedlingsToStars.com site looks at Anthony Rendon.
  • The USA Today does an in-depth, position-by-position overview of the team and where it stands.
  • Another Tom Boswell article that I disagree with; he thinks Prince Fielder isn’t “right” for the Nats.   I’m sorry; but Fielder is a run creating machine (he created 35 more runs last year than Michael Morse, by way of comparison, which roughly equates with his 5.2 Wins Above replacement value).  Yes we have LaRoche who is plus defense, but is he going to come back to 2010’s form or is he going to be a lost cause again?  Meanwhile, Fielder looks set to take a shorter term deal and re-try his hand at the FA market when he hits 30.  Wouldn’t you sign him for 3yrs $70M?  You put Fielder at 1B, keep Morse in Left, groom Bryce Harper to play center and keep Werth in right.   For the next 3 years.  How difficult is that?  Boswell talks about where to put Rendon; well; you put him wherever you have a need.  Put him at 2nd and move Espinosa to short.  Or you trade someone to free up room.  This team’s problem isn’t the need for a lead-off slap hitter; we need a big run producer in the middle of the order.  Someone to replace what Adam Dunn gave us for two years.
  • Ryan Tatusko posts his 2011 recap of his minor league season plus his time in the Venezuelan Winter League.  I wish more players were as blogger-friendly as Tatusko.

Hall of Fame Specific

  • A pro Edgar Martinez take with the important quote, “There is a position called DH…”  I have changed my own stance on this issue in recent years, especially when considering relief pitchers as hall of fame worthy.  If you argue that a closer and his 60-70 innings is somehow more valuable to a team than a designated hitter’s 650 at bats, then I’d have to disagree.  On my hypothetical ballot, Martinez is in.
  • Excellent review of active MLB players under HoFame consideration by Fangraph’s Dave Cameron.   Also, the comments discussion brings up a number of other players.  He uses primarily career WAR to determine the player’s value, which I’m somewhat hesitant about (in most cases WAR is an accumulator stat, as a mediocre player who stayed very healthy will have a higher WAR than an excellent but shorter-lived career).
  • This article really got to me, to the point where I commented on both the original post by Jay Jaffe at Baseball Prospectus and the discussion at TangoTiger‘s InsideTheBook.com blog.  Jaffe’s hall of fame measuring system (called JAWS) somehow has determined that Brad Radke, the middling pitcher for the Twins who had basically one standout season in his career, was a BETTER player career-wise than Jack Morris.  How would any sane baseball observer possibly come to this conclusion?  This is where the modern blogger’s over-reliance on statistics really gets to me.  I have not read into why this system ranks Radke so high while ranking Morris so low but suspect it is due to a reliance on the same calculations that go into the ERA+ statistic (of which Radke’s career ERA+ of113  is better than Nolan Ryan‘s career era of 112).

Free Agents/Player Transaction News

  • Oakland continues to dismantle itself: Boston trades OF prospect Josh Reddick and two other players to Oakland for closer Andrew Bailey and outfielder Ryan Sweeney.  This is after Boston acquired Mark Melancon earlier in the off-season; they now have completely remade the back side of their rotation.  Clearly the team is moving Daniel Bard to the rotation, having just traded for his replacement.   Reddick was clearly seen as surplus to requirements, despite putting together a decent 2011 season, but you have to wonder if the team is going to be satisfied with Sweeney starting in RF.
  • Keith Law makes a good point during his analysis of the Bailey move, saying that adding Bailey is a far better move than paying Jonathan Papelbon $50M.  I agree completely and think that anyone who pays $10M+ per year for a guy who throws 70 innings and who only really has about 50% “high leverage” plate appearances (see last year’s splits for Mariano Rivera and Papelbon to see that 57% of Rivera’s plate appearances were in “high” leverage situations as a high, while Papelbon was at 47%) is just wasting money.  Find a hard thrower in your organization (say, like Drew Storen for the Nats), install him as the closer as a rookie, then ride him til free agency and then cut him loose and start over.  Relievers are fungible talents, they come and go, mostly are failed starters since they don’t need the full repertoire of pitches to be successful, and are cheaper to come by.
  • (hat tip to ck of the Nats Enquirer): The Baltimore Sun reports that Scott Boras and Prince Fielder were in the Baltimore/DC area to meet with an owner not named Peter Angelos.  More links on the topic from Federal Baseball.  Gee, I wonder who it could be?  Why would those two fly HERE and not directly to the city of the owner in question, unless the owner of the team in question was either a) the Nationals, or b) an owner of a MLB team who lives in this area but owns a team based elsewhere, or c) an owner of another team just happened to be in DC for some odd reason (odd because Congress is out of session, which would seem to eliminate most any possibly lobbying reason).  Don’t get me wrong; I think Adam LaRoche can contribute in 2012 and it seems ludicrous to think he can’t at least get close to his 2010 numbers, but Fielder is a 5+ WAR player who probably makes us the favorite for the NL wild card if we sign him, right now.

General Baseball News

  • Wow, two LOOGY articles in the same day.  Bill James answered a question about the evolution of the LOOGY and posted this link describing its birth (apparently by Tony LaRussa in the 1991 season).  I also never knew that the term “LOOGY” was coined by none other than Rob Neyer.  And TangoTiger points to some of the same research.  Mid 30s lefties everywhere have LaRussa to thank for their extended careers.
  • Could you imagine this happening in today’s game?  The first intentional pitch would have resulted in ejections.  Certainly modern umpires would not let a pitcher throw pitch after pitch at an opposing batter.  Clearly these umpires let this game get out of hand.
  • Will MLB step in?  USAToday’s Seth Livingston thinks that the Oakland payroll dumping trades this off-season may get the attention of the front office.  Hard to see why; according to Cot’s the Athletics are only signed up for around $17M of guaranteed contracts in 2012 right now, before a slew of arbitration cases.  They non-tendered 3 of their 10 arbitration cases but kept a couple of their more expensive guys (Cot’s thinks they had 14 arbitration-eligible players; I havn’t cross-referenced outrights and DFAs but know they had 10 arb tender decisions).  Of those they did tender, they have since traded away Sweeney, Gonzalez, Bailey, Breslow and Cahill.  Geeze.  Baseball-Reference thinks they’ll get to $50M in payroll; I wonder if they’ll get to $35m frankly.  And, its looking more and more like this could be something like a 50-win team.  Things could get ugly in the Bay area in 2012.
  • This would be a loss for us prospect hounds: Keith Law is reportedly interviewing for a front-office position with the Houston Astros.  Law takes a very specific, opinionated viewpoint towards player development, drawing from his experiences in the Toronto organization (which itself during his time took a rather college-heavy approach to the draft which ultimately wasn’t as successful as the team wanted, ultimately contributing to the end of JP Ricciardi‘s reign.
  • An interesting exercise; USA Today builds an unbeatable MLB team for the median MLB payroll.  Honestly though, I’m not sure just how challenging this exercise is.  If you gave me $86M (the median payroll they used) you should be able to put together TWO such teams.  There’s enough pre-arbitration and arbitration-controlled talent in the league to be able to do the same task for something approaching a $20M payroll.  A future blog post?  🙂
  • Follow-up on Alex Rodriguez‘s experimental Germany treatment; this op-ed piece from Jeff Passan on the blurry line between PEDs and legitimate surgical procedures.  The article has a very in-depth description of the A-Rod procedure and raises the question as to what defines a Performance Enhancing Drug?  I have had similar discussions; why are Steroids “bad” but Cortisone “good” in terms of usage?  What do Cortisone shots do?  They enable a player to play through pain that otherwise may keep him out.  Uh … isn’t that the definition of a “performance enhancing” substance??  Steroid’s aren’t illegal; they’re just controlled.  But so is cortisone; you can’t just inject yourself with the stuff without a doctor’s order.  Passan takes things one step further, comparing the healing effects of HGH with these new treatments that A-Rod and Bartolo Colon got and makes a very good point; the WADA uses 3 categories to define a doping drug and everything we’ve described here can be argued to fit those criteria (except that only HGH and Steroids have been determined to be “bad” by the powers that be).  There’s something inconsistent here.

Collegiate/Prospect News

  • Seedling to the Star’s scouting report on Braves phenom prospect Julio Teheran.  Teheran’s stock has slipped somewhat in the past two years, especially given the inevitable comparisons to fellow pitching prospect phenom Matt Moore.  While Moore’s 2011 MLB debut was nothing short of amazing (including his 7 innings of shutout ball in the playoffs), Teheran posted a 5.03 ERA in about 20 MLB innings throughout 2011.  It was bad enough to probably rule Teheran out of the 2012 rotation plans and send him back to repeat AAA.  But if he can put things together, he’ll join an arsenal of young arms in Atlanta that seems set to be their next wave of starters in the ilk of John Smoltz and Tom Glavine.


General News; other

  • Baseball meets modern America: Joe Maddon and the rising Latino population in his home town of Hazelton, PA, as written by Joe Posnanski.
  • 67-56?  I’ve never seen a football game with such a ridiculous scoring line.


2012 Hall of Fame Ballot thoughts

8 comments

Can we please elect one of the best hitters of the last 30 years? Photo via bill37mccurdy.wordpress.com

On November 30th, the BBWAA announced the 2012 official Hall of Fame ballot.  Let the cavalcade of Hall of Fame opinion pieces begin! (just a few early examples here, here, and here).

We all knew who was eligible for this ballot, thanks to the excellent work at baseball-reference.com.  All the anticipated ballots are available for perusal along with statistical summaries of each player’s career and a few Bill James-inspired metrics created to give simple statistical measures of Hall-worthiness.

2012’s ballot is the last year before the Steroid accused superstars start becoming eligible (Bonds, Sosa, Piazza, and Clemens are all on the 2013 ballot for the first time, in addition to Schilling and Biggio) and the narrative about Hall of Fame voting turns to morality voting for the next decade or so.  Gee, I can’t wait.  All these players played in an era where there was no testing against PEDs and no MLB-specified rules against PEDs, but voters continue to penalize these players as if testing WERE being done, as if there WERE rules at the time they played.  Meanwhile nobody talks about the PEDs that were prevalent for the last 30 years or so (amphetamines, or “greenies” in baseball parlance), and many players from the latter part of this decade freely talk of playing on speed.  Frankly, it isn’t fair.  We didn’t penalize Bob Gibson and put an asterick next to his accomplishments for pitching in a pro-pitcher, massive ballpark era did we?  No; that was the game at the time.  We don’t talk about how baseball fields used to be caverns with 480 foot distances and 30 foot walls, making triples far more common than homers.  No; that was the game at the time.  And frankly. the steroid era will eventually be remembered for what it was.  Sometimes I think the anti-PED crowd is just a bunch of middle-aged white guys who are really peeved that an arrogant black ballplayer in Barry Bonds broke the cherished home run records of storied players from their youth (Babe Ruth and the far more likeable Henry Aaron).  But I digress.

That being said, I like doing these Hall of Fame blog posts, if only because I usually disagree with the rest of the baseball blog-o-sphere on what really constitutes a Hall of Famer.  I’ve been watching baseball long enough to form my own independent opinions on players and not depend on revisionist historians turning mediocre players into other-worldy hall-of-fame electees (see Blyleven, Bert and my stated opinions on his Hall-worthiness ahead of the 2011 ballot, and especially read the comment section where people refuse to address any aspect of Blyleven’s playing career and only use statistics to canonize him).

Notwithstanding that comment, I believe we’re being too parsimonious with Hall of Fame elections.  Nate Silver from the NY Times wrote on this same topic in January of 2011, pointing out another interesting fact about the Hall of Fame (namely that roughly 13% of active major leaguers at various points in the 1930s and 1940s are now in the Hall).  I’m not advocating that we need to be looking at 10% of current active major leaguers for the hall, but I am advocating that we be less “parsimonious” with the voting.  This may seem contradictory to my opposing the candidacy of Blyleven; not so.  There are a number of very deserving candidates who are not getting the votes they need.  There seems to be several reasons for this:

  • Players whose accomplishments in the pre-Steroid era are being discounted for the lack of “big numbers” (Larkin, Raines, Trammel, McGriff to certain extents).
  • Players who toiled in the Steroid era are either users/suspected users (McGwire, Palmeiro), or are being caught in the steroid web (Bagwell).
  • Players who are suffering from a conflict of opinion in the voter base for various reasons (Smith, Morris, Martinez).

I’m not sure how to resolve any of these situations frankly.  But I’d hate to have these players languish on the ballot and age off of it and have to wait for some nebulous Veterans committee to enshrine them after they’re dead (see Santo, Ron).  Some people advocate modifying the voting methodology, but in reality there’s no easy fix.

Back to the 2012 ballot: the only candidate eligible for the first time this year worth any discussion is Bernie Williams.   For me, Williams was a nice player who retired early instead of facing the inevitable end of his Yankee career.  He was part of a great core group of home-grown Yankees that formed the core of the late 90s dynasty team and will certainly be remembered as a great franchise player.  That’s not enough; he was never the best player on his own team, he never sniffed an MVP vote and he never accumulated enough production to warrant being a focal point in the opposition.  He had a great 5-year run … but if we were electing people on 5-year runs then Juan Gonzalez would already be in.

For the rest of the remaining candidates, I’ll borrow some from last year’s version of this post.  I’m not going to go into major statistical analysis for each candidate (that analysis is freely available on most every major baseball blog site out there), but will state my opinion with a few choice links.  On my hypothetical ballot I’d vote for:

  • Jeff Bagwell: a career 149 OPS+.   That’s a career averaging nearly 50% better hitting than the average MLBer.  That he’s being lumped in with actual PED users without a shred of proof has become the latest hall of fame “cause” on the internet, starting with this excellent article accusing BBWAA writers of “plagiarism” (when I think he really means laziness, frankly).  At least I support this one.  Here’s an excellent case for Bagwell.  You won’t find anyone penning a “case against” him that doesn’t claim that he’s a PED user without the proof.
  • Jack Morris.  The “anti” sabrematrician selection.  Here’s a link to the most canonical case against Morris, as well as Joe Posnanski‘s anti Morris (and anti-other) rant.  And here’s a case for Morris from former Washington Post writer Richard Justice, now with MLB, which goes a lot towards my way of thinking about the guy.  Lots of people seem to be spending as much time arguing AGAINST him as they did arguing FOR Blyleven.  I wonder why that is?  Maybe there really just is a kind of pitcher who you had to see in context versus looking at his stats after the fact.  Nolan Ryan “only” had a 112 ERA+ for his career and was barely a .500 pitcher, yet was a first ballot overwhelming hall-of-famer.  There’s some disconnect here.  For me, the vote for Morris is about the “feeling” of a dominant pitcher, just as Blyleven was about the “feel” of a mediocre pitcher, no matter what his eventual career stats looked like.  For people who say this is fallacy, I say this: judgement of a player can not ONLY be done by looking at his stats.  Morris had a reputation for “pitching to score,” though sabrematricians have attempted to debunk that pitching-to-score exists for some time (see this link on baseball prospectus, then note at the bottom that despite 3500 words he says “none of this proves it doesn’t exist.”) but he also had a reputation for being the “Best pitcher of the decade.”  Bill James published a list of factors to consider, when evaluating a player’s candidacy, and the one takeaway I got from that list was (paraphrased) whether or not a player was the best on his team, the best in his league, a guy that the other team was afraid of.  Morris was that, for a period of more than 10 years.  His last two seasons took him from a 3.70 era to a 3.90 career era, and may have pushed him over the edge to his current stat-nerd polarizing stance.  For me, he was THE pitcher of the 80s, led one of the most dominant teams ever (the 1984 Tigers) and pitched a 10-inning complete game win in one of the best games ever played.  Those things stand for something, and should add up to more than a clinical analysis of his era+.
  • Barry Larkin: lost in the shadow of Ozzie Smith for so long, that people forget that he was an excellent defender AND a great hitter.  Long overdue for enshrinement.  Here’s a pretty stat-heavy analysis FOR him.
  • Tim RainesCase for.  Its hard to find cases against.  Raines, like guys like Trammell and Larkin, played in the shadow of Rickey Henderson for so long and was always judged to be 2nd best.   But his accomplishments, especially during the earlier part of his career, should be enough to get him into the Hall.
  • Mark McGwire: He was a lock before the PED ensnarement.  I say “ensnared” despite him using a completely legitimate supplement at the time.   He didn’t try to hide it either.
  • Edgar Martinez: I recently watched one of the games from the great series “MLB’s greatest games” of the last 50 years, and one of the games was the great game 5 playoff in 1995 between the Mariners and the Yankees.  David Cone in that broadcast said that Martinez was “the best right handed hitter he ever faced.”  And it struck me; Martinez indeed was one of the most feared hitters of his day.  Look at his career: he didn’t play a full season til he was 27 and he played a ton of DH.  He also retired with a career slash line above the mythical .300/.400/.500 targets.  For those that discount his heavy use at DH I ask one simple question: if you think Martinez didn’t contribute that much by just being a DH, then how can you possibly support the inclusion of a one-inning relief pitcher/closer?  Who do you really think contributes more, a DH with his 650 PAs or a relief pitcher with 60-some innings in a season?   In reality, you can’t.  It just takes an uber-DH like Martinez to press the issue.

Specific Names i’d leave off and why:

  • Alan Trammell: I just don’t think he was a dominant enough player to warrant inclusion.  I’d place him well behind his peers at shortstop for the ERA.  There’s plenty of support for him in various forums though, with good arguments for him.
  • Lee Smith: My tried and true argument; closers are incredibly overvalued, and especially closers with lifetime ERAs in the 3.00 range and with a career whip that’s closer to a league average than it is to dominant.  Sorry; Smith isn’t a HoFamer for me.
  • Larry Walker: the whole “he played in Colorado” angle probably isn’t as true as we think, but he still enjoyed a bump in his stats because of it.  Otherwise he’s in the hall of Good, not the Hall of Fame.
  • Rafael Palmeiro: its less about his idiotic stance in front of congress as it is about his method of “accumulating” his way to historic numbers.  Much like the discussion we’ll eventually have about Johnny Damon (who is only a few hundred hits away from 3000 but clearly isn’t a transcending player), Palmeiro was always a good, solid guy but never that much of a game changer.
  • Don Mattingly: I would love to vote for Donny Baseball, but being the Captain of the Yankees just isn’t enough (well, unless you’re a NY writer).  Retired too early, not enough power for a first baseman, peaked at 25 and struggled into his 30s.

Let the comments calling me an idiot for supporting Jack Morris begin.

Where would 2011 WS Game 6 rank all time?

12 comments

David Freese's name will go down in history for his historic Game 6 performance. Photo AP/Jeff Roberson via foxnews.com

(This post was inspired by the very last question in David Shoenfeld‘s 12/20/11 chat, asking where this game ranks among the greatest ever games played).

For those of you with the MLB network (channel 213 on DirecTV), the series they featured this year profiling the “Greatest 20 games of the last half century” was my favorite bit of sports programming since the 30-for-30 series on ESPN debuted.  Bob Costas and Tom Verducci hosted and did 1-2 hour reviews of these 20 games and brought in guest hosts for each game in the form of actual players and managers who participated in the games themselves.  These guest hosts provided fantastic commentary on the state of the dugouts at each critical juncture as well as first hand knowledge of their own thought processes throughout.  If you haven’t seen the series, I highly suggest setting your DVR and watching them.

Now the interesting question: where would Game 6 of our most recent World Series have ranked, if it were a candidate to be included?

For me, game 6 was absolutely the most entertaining game I’ve ever witnessed, in person or on TV.  It wasn’t the best played game (with errors and questionable manager decisions and no less than three blown saves) but it was amazingly entertaining, suspenseful, and with a story-book ending that was almost out of a movie script.  But does it rank with the best game list that MLB network came up with?

First, here’s their list, counted down from 20 to 1 (with captions borrowed from the MLB link above and augmented by me):

  • No. 20: May 17, 1979: Phillies @ Cubs; Phils, Cubs combine for 45 runs.  This is the only regular season game on the list and for good reason; the first inning alone had 13 runs scored.
  • No. 19: Oct. 4, 2003: Giants @ Marlins; Ivan Rodriguez tags out Eric Snow as he tries to bulldoze Pudge at the plate to end the game and send the Marlins to the World Series.
  • No. 18: Oct. 12, 1980: Phillies @ Astros; Phils win battle in 10th to win the NLCS with an epic comeback over Nolan Ryan.
  • No. 17: Oct. 17, 2004: Yankees @ Red Sox; Dave Roberts‘ stolen base and David Ortiz‘s walk-off homer cap the Boston win, an epic part of the Boston comeback from 3-0 down in the 2004 ALCS.
  • No. 16: Oct. 6, 2009: Tigers @ Twins; Twins win a game 163 sudden death playoff game for the AL Central title.
  • No. 15: Oct. 8, 1995: Yankees @ Mariners; Edgar Martinez hits “The Double” to get a walk-off win in the ALDS, capping a 10th inning comeback as a young Ken Griffey Jr absolutely flies around the bases to score from first.
  • No. 14: Oct. 23, 1993: Phillies @ Blue Jays; Joe Carter‘s walk-off WS homer foils a great Philly comeback.
  • No. 13: Oct. 26, 1997: Indians @ Marlins; Edgar Renteria wins it for Fish in a World Series game 7 classic.
  • No. 12: Oct. 31, 2001: D-backs @ Yankees; Tino Martinez ties it with a 2-out, 2-run homer in the bottom of the 9th and Derek Jeter hits first November homer and earns himself the nickname for which he’s continued to be known.
  • No. 11: Oct. 2, 1978: Yankees @ Red Sox; Bucky Dent‘s improbable 3-run homer caps a massive October collapse for Boston and continues the legendary rivalry between the teams.
  • No. 10: Oct. 15, 1988: Athletics @ Dodgers; Injured slugger Kirk Gibson hits a pinch hit walk-off home run off of the dominant Dennis Eckersley for one of the most magical home runs in baseball history.
  • No. 9: Nov. 4, 2001: Yankees @ D-backs; Luis Gonzalez floats a ball over the drawn-in infield against Mariano Rivera to win a classic Game 7.
  • No. 8: Oct. 12, 1986: Red Sox @ Angels; Dave Henderson hits an improbable 3-run homer in the 9th to help Boston come back from 1-out away from elimination to eventually beat the Angels in the 86 ALCS.
  • No. 7: Oct. 14, 2003: Marlins @ Cubs; The infamous Steve Bartman game, which overshadowed an utter collapse by Mark Prior, Alex Gonzalez, the Cubs bullpen AND Kerry Wood the following day to continue the Cubs curse that lasts til today.
  • No. 6: Oct. 16, 2003: Red Sox @ Yankees; Aaron Boone suddenly homers off Tim Wakefield in extra innings to end a classic ALCS game 7 between the bitter rivals.
  • No. 5: Oct. 15, 1986: Mets @ Astros; Mets win in 16 as Jesse Orosco put in the relief performance of a lifetime.
  • No. 4: Oct. 14, 1992: Pirates @ Braves; the injured Sid Bream barely beats Barry Bonds‘ throw to score the series winner and effectively send the Pittsburgh franchise into a 20 year tailspin.
  • No. 3: Oct. 25, 1986: Red Sox @ Mets; Probably the most “infamous” game of all time, especially to Boston fans, as Bill Buckner‘s error follows a series of mishaps by the Red Sox pitching staff to turn a 10th inning 2 run lead into a game 6 loss.
  • No. 2: Oct. 27, 1991: Braves @ Twins; Jack Morris‘  seminal performance; a 1-0 10 inning shutout over the Braves in perhaps the best Game 7 of any World Series ever.
  • No. 1: Oct. 21, 1975: Reds @ Red Sox; the game forever known for Carlton Fisk waving his walk-off homer fair, but which should be known for the unbelievably clutch Bernie Carbo 8th inning homer to tie the game and enable the extra inning fireworks.

(A quick glance at the top 20 list above has one glaring game that I’d honestly replace immediately; the Bartman game was more iconic for the individual play and not for the game itself, which ended up being a blowout when all was said and done.  Nearly every other game on this list featured late game comebacks and walk-off hits).

The earliest game on this list is 1975 and if the moniker “last 50 years” is true then the classic Bill Mazeroski homer game from game 7 of the 1960 World Series must not have been eligible.  Because certainly it should have been in the top 5 otherwise.  A quick note about this game; click on the link for the box score to imagine just how amazing this game must have been.  Recap:

  • Pittsburgh jumps to a 4-0 lead early.
  • Yogi Berra and Mickey Mantle help spark a 4-run rally in the 6th to take a 5-4 lead.
  • The  Yankees extend their lead to 7-5 in the top of the 8th.
  • The Pirates rally for FIVE runs in the bottom of the 8th for a 9-7 lead.
  • The Yankees’ two hall of famers Berra and Mantle manage to drive in the tying runs in the top of the 9th to make it 9-9.
  • Mazeroski blasts a walk-off homer on a 1-0 count to lead off the bottom of the 9th and win the world series.

Where to put 2011’s game 6?  I think I’d place it right around the #4 spot.  David Freese‘s heroics will soon settle into place as one of the legendary performances in post season history.  I can’t dislodge the current top 3 games on MLB’s list.  Its a common folly for the immediate labeling of recent events as “the best ever” without standing the test of time, but in this case I feel comfortable in the statement that this game is one for the ages, absolutely.

Does Verducci’s article about Strasburg’s Mechanics worry you?

4 comments

This is an image I hope we don’t see again.

In an article that seemingly came out of nowhere, Si.com columnist Tom Verducci posted this missive on 3/8/11 with ominous warnings to Nationals fans everywhere.  He believes that Stephen Strasburg has a fatal flaw in his mechanics related to the timing of his stride forward off the rubber versus his release point that may continue to plague the pitcher even after his post Tommy John surgery recovery.

I say this article comes out of nowhere since I would have expected to see this posted back in August 2010, when every other pundit posted their own theories as to why “the best pitching prospect ever” suddenly blew out his elbow.  I reviewed some of those explanations at the time but thought (and still do think) that his injury was less about his release point and more about pitch selection.  I think that Strasburg (and more importantly his catchers) fell in love with his change-up after discovering what a devastating pitch it was (imagine facing a 91-mph screw ball that moves a foot into the right handed hitter).  Suddenly he was throwing a ton of circle changes and placing unexpected, here-to-fore unseen stress directly on his elbow ligament.  When a hurler goes from pitching one day a week in a protected environment where he can get by throwing mostly fastballs to overpower college hitters to suddenly throwing only about 58% fastballs (per Verducci’s research) at the Major league level every 5 days, sudden injury onset can occur.

Verducci touches on the preponderance of off-speed pitches Strasburg was throwing in the article but focuses on the “late cocking” of the arm as the primary culprit of the injury.  He then lists a number of pitchers who exhibit this same late arm cocking with (conveniently) a ghastly list of arm and shoulder injuries that followed.

Here’s my problem with this type of cherry picking of arm injuries; as Mike Rizzo pointed out in the article, you can probably find a similar subset of pitchers who exhibit the same late-cocking of the arm who have NEVER had an arm injury.  Rob Neyer posted a similar opinion in a Verducci-followup piece.  Similarly, those who subscribe to the “Inverted W” pitching mechanical flaw fail to point out that, while there are plenty of examples of pitchers who show the inverted W behavior (most notably in most examples is Mark Prior but Strasburg exhibits the same mechanics as well), there are also plenty of pitchers who do the same motion but who never have had a serious injury.  People always forget to mention this fact and their articles always come off with the message that “if you exhibit this, you are doomed.”

John Smoltz was listed as a pitcher who had this fatal mechanical flaw (he also has inverted W syndrome) and listed as an “example” of what can happen.  Yes Smoltz blew out his elbow in his early 30s and missed an entire major league season.  But he also pitched until he was 42, made over 700 major league starts, won 213 games and saved another 154 while he was in the closer role theoretically “protecting” his arm.  If Strasburg gives the Washington franchise those kinds of numbers between now and the year 2030 (when he too will be 42 years of age) I will never quibble.

For me, shoulder injuries are the injuries that you really worry about.  Look at Chien-Ming Wang right now; he’s throwing in the low 80s 2+ years on from shoulder surgery.  The Nats have taken fliers on several other post-shoulder injury starters over the past few years (Brian Lawrence, Ryan Drese, John Patterson) with limited success.  However, pitchers seem to be able to recover from Tommy John surgeries with much better regularity.  I realize our own Shawn Hill had the TJ surgery and never really came back, but the list of successful pitchers who have had the TJ surgery is long.  3 of the top 5 NL Cy Young candidates last year (Josh Johnson, Tim Hudson and now Adam Wainwright) have had the TJ surgery, as did 2009 NL cy Young winner Chris Carpenter.  Our own Jordan Zimmermann seems to be nicely recovering, although it is far too soon to conclude that his surgery was a success.

I sometimes wonder what modern medicine could have done with Sandy Koufax, who abruptly retired at age 30 after a Cy Young winning season where he made 41 starts and went 27-9.  His retirement reason was listed as “arthritis in his pitching elbow” and he had symptoms that included massive hemorrhaging in his arm; was this a condition that would be easily solved today?

For Strasburg, as with pretty much any baseball pitcher, in many ways every pitch could be your last.  Modern medicine can fix all kinds of injuries and modern technology can pin point the wheres and whys of why some guys may last and some guys may be flashes in the pan.  But in the end, some guys physiologically are more durable than others, some guys can throw a ball through a brick wall for 25 years (see Ryan, Nolan) and others break down after just a few professional games.  Lets just hope for the best once Strasburg comes back.

http://en.wikipedia.org/wiki/Tommy_John_surgery#List_of_notable_baseball_players_who_underwent_the_surgery