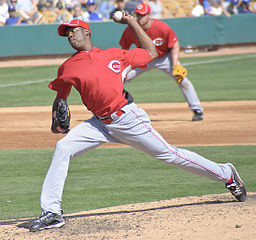
Chapman is amazing. Photo via wiki/flickr SD Dirk
(Editor’s Note: This post was originally published on 9/2/2010, edited several times since, including links to the 105.1 pitch later in 2010 and him hitting 105.1 again in 2016, plus 2020 and 2022 readings and addition of additional links).
If you believe twitter and these published reports, Cincinnati’s Cuban prospect Aroldis Chapman “sat” at 103 and hit 105mph in his final AAA appearance before getting called up for the 9/1/2010 roster expansion. I had a hard time believing it; the picture in the Yahoo looks doctored frankly, and stadium guns are notoriously “jacked up” to get the crowds excited and to spark interest in hard throwers.
There are two kinds of radar guns used by stadiums and scouts today. A “fast” gun measures the speed of the pitch as it leaves the hand of the hurler while a “slow” gun measures its speed by the time the pitch crosses the plate. For obvious reasons you’ll take the “fast” reading if you’re trying to hype the player, and you take the “slow” reading if you’re trying to evaluate the pitcher. Oh, and you take readings over and again, compare first inning to last inning, etc. My thoughts were that Chapman was on a fast gun that was over-exaggerated to add a couple MPHs (case in point; Jordan Zimmermann‘s radar readings on the telecast two nights ago put him at 96mph when his pitch f/x maximum was 94). Click here for an excellent overview of the way we’ve measured velocity has changed over the years.
Now, that being said, check out the Pitch F/X data from Chapman’s first appearance in the majors on 8/31/2010, and his second appearance on 9/1/10. In his major league debut he threw 6 fastballs with an average of 100.65 and a max of 102.7mph. This in and among itself would have been amazing and would have tied the fastest ever recorded pitch f/x data (that of Joel Zumaya hitting 102.7 in a game in June 2009)
However, look at the data from 9/1/10. He threw 7 fastballs that AVERAGED 102.11 mph with a peak of 103.9mph. 103.9!!
Before talking about new records, lets talk about history.
Now, I know there’s a ton of links out there talking about what the fastest ever reported pitch is on record (see links here or here at HardBalltimes or this google cache’d document as well as wikipedia or Guinness Book of World records links).
- Walter Johnson was known for his power in the early part of the century; his fastball was estimated to be in the upper 90s by lore, and 91mph by testing. Its a shame that modern technology didn’t exist back then.
- Bob Feller being “recorded” using primitive measures in the 107mph range.
- Steve Dalkowski’s legendary velocity being claimed at 110mph.
- Nolan Ryan‘s “record” of 100.9mph has stood as some sort of altar to the speed ratings for years and years.
Lets discuss some of these points.
Bob Feller: So, what is the “proof” that Feller threw 107.6 in 1946? Well, its complicated. This ESPN article covers it: basically Feller threw a ball through a Lumiline Chronograph device, which hyper-accurately measured speed at the time. His best measure was 98.6mph … but modern pitches are measured at the point of release, not where it crosses the plate. So, you have to estimate how much velocity was lost from the point Feller tossed the ball to the device. If you look at the photo (in the ESPN article), Feller was not throwing from the mound, but somewhere well forward of it. So, to standardize speeds to some point closer to the release point of the pitch, we have to estimate the percentage loss of Feller’s pitch from an estimated delivery point based on a photo, then back into a number. Some estimate this to be in the 103 range, others claim 107.6, which would imply he was throwing off the mound and experiencing the full expected velocity loss (which is clearly not true from the photo). So I’d believe Feller was throwing roughly 103-104 based on where he released the ball … but its an estimate. Add back 1mph for every 7 feet, and Feller seems to be standing at about 35 feet, so add perhaps 5mph to his 98.6 and you get the 103-104 rough estimate.
Coincidentally; the new standard is speed of the pitch measured at 50 feet from home plate. This standardizes to allow for different release points by pitchers of different heights.
Steve Dalkowski: rumors of 110mph were mostly lore, but attempts were made to measure Dalkowski’s velocity. Famously, he was measured at 98.6 at a military base in the 1960s, but there were some interesting caveats to that test. According to this NYtimes article, the day Dalkowski attempted this test, he had thrown a 150-pitch start the DAY BEFORE, then had such a hard time throwing a baseball through the measuring device (he was notoriously wild) that it took him “dozens” of attempts before finally registering one pitch at the 98.6mph level. It was the only known measurement of his arm ever done, and one has to think that (similarly to Ryan’s 100.9 speed below) he’d gain several mph just to standardize the speed to today’s 50-foot guidelines, and, frankly, his arm was probably toast during the test.
(Side Note: if you’ve never heard of Dalkowski … his wikipedia page is a pretty good read).
Nolan Ryan: How about proof that Ryan threw 108.1, as is throw around the internet? Well, It comes from the famous 100.9 reading he put up in a start in 1974. However, that was reading was made using technology that, again, measured the speed closer to the plate than we currently do. Per this article (which summarizes findings from a documentary called Fastball), the radar technology measured 100.9 ten feet from home plate, meaning we have to back up to the 50 feet estimate. So, if the speed was measured at 10 feet, and we normally measure at 50 feet, we should add back “40 feet” of velocity loss, at around 1mph per every 7 feet, so call it somewhere between 5-6 mph … and we’re somewhere in the range of 106-107mph. Not 108.1 as everyone claims; that’s adding back too much velocity and/or giving Ryan 10 feet more of credit (the measurement at the plate versus 10 feet in front). These are still estimates of course; these speeds are also affected by the weather at the time (it was in Sept of 1974 in Anaheim … was that a humid day, an arid day? Anaheim’s typical September weather is humid, hot; was it really humid that night? Was it relatively dry? That makes a huge difference in aerodynamics of a baseball and potential velocity loss. So … we’ll never know.
Coincidentally, these velocity loss estimates are best documented by a physicist at the University of Illinois named Dr. Alan Nathan. He estimates that baseball pitches lose 9-10% of their velocity from the point of release to the plate. Example; if you release a ball at 100mph, it will generally measure at 90-91 by the time it crosses home plate. Or, to put it easier … a pitch loses about 1MPH every 7 feet.
Other rumors and records for fast pitches suffer from perhaps hype and estimates, not science. Zumaya reportedly hit 104.8 in the first game of the 2006 ALCS, but it was on the stadium gun, not Pitch F/X. Ryan and Goose Gossage both reportedly hit 103mph in the 1978 All-Star game. Stephen Strasburg reportedly could hit 102 as an amateur but rarely goes about 97 post-arm injury. Justin Verlander may not have the triple-digit records but amazingly maintains his upper-90s throughout games, often hitting 100mph in his last inning of work.
I think Chapman’s speed last night is the new standard. And a pretty amazing accomplishment.
—
Post publishing Editors notes: Chapman set a new MLB record on 9/24/10, after this article’s initial posting, throwing a documented 105.1mph. He also threw a ball at 104.6 on 7/28/14. Not quite as fast as his best ever … which I’m guessing even Chapman doesn’t think he’ll ever beat, since he got the reading tattooed on his wrist. Then on 7/19/16, years after his first record, he tied it again, throwing another ball 105.1. Here’s the StatCast link for this pitch. Coincidentally, this 105.1 pitch is now officially registered at 105.8 by MLB, because the technology we use now standardizes the pitch speeds at a specific distance, and Chapman’s 105.1 was measured further down from where we now standardize.
As of this writing, the Guinness Book of World records recognizes Chapman and 105.8 as the world records.
Post-posting related link: BA’s J.J. Cooper posted this Q&A session on 4/28/15 talking about Chapman and 101+ MPH pitches.
Jan 2017: Boston pitching prospect Michael Kopech, who is renowned his velocity, hit 110 MPH during a “max velocity” workout early in spring training by crow hopping. Impressive, but not the same as throwing off a mound. Holy mackerel! How long before this kid gets to the majors and has a gun on him??
May 2018: we may have a new gold standard; Jordan Hicks threw a reported 105.1 MPH fastball, but Pitch FX shows it at 106.1. (Unfortunately the PitchFX data at BrooksBaseball site now does not work, so my “evidence” is gone). However, subsequent reporting on this pitch have lowered it to the mid 104s, so it remains unclear what its real velocity was to this day.
May 2022: University of Tennessee’s Ben Joyce threw a pitch recorded at 105.5 in a college game. Does Tennessee have Pitchfx? Was this a juiced gun? We’ll have to see.